
Debugging Code
A bug is a programming error that makes a program fail to produce the correct result. The
program might crash, display incorrect data, or do something completely unexpected such as
delete the wrong file.
In this lesson you learn how to use the excellent debugging tools provided by Visual Studio’s
IDE to find bugs in C#. You learn about different kinds of bugs and you get to practice debug-
ging techniques on some buggy examples that you can download from the book’s web site.
DEFERRED TECHNIQUES
Unfortunately at this point in the book you don’t know enough about writing code to be able to
understand and fix certain kinds of bugs. For example, a program crashes if it tries to access an
array entry that is outside of the array, but you won’t learn about arrays until Lesson 16.
So why does this lesson cover debugging when you don’t even know all of the techniques you
need to cause and fix certain kinds of bugs? It makes sense for two reasons.
First, the previous lesson was the first part of the book where you were likely to encounter bugs.
Whenever I teach beginning programming, students start seeing bugs as soon as they write code
that performs calculations like those covered in Lesson 11. These kinds of bugs are easy to fix if
you know just a little bit about debugging but can be extremely frustrating if you don’t.
Second, it turns out that you don’t need to know more advanced techniques to learn simple
debugging. Once you learn how to track down simple bugs, you can use the same techniques
to find more advanced bugs. (If you learn to swim in 3 feet of water, you can later use the
same techniques to swim in 10 feet or 100 feet of water.)
Later, when you know more about C# programming and can create more advanced bugs, that
same knowledge will help you fix those bugs. When you know enough to have array indexing
errors, you’ll also know enough to fix them.
12
596906c12.indd 151 4/7/10 12:32:40 PM
152
LESSON 12 Debugging CoDe
DEBUGGING THEN AND NOW
Back in the bad old days, programmers often fixed bugs by staring hard at the code, making a
few test changes, and then running the program again to see what happened. This trial-and-error
approach could be extremely slow because the programmer didn’t really know exactly what was
going on inside the code. If the programmer didn’t have a good understanding of what was really
happening, the test changes often didn’t help and may have even made the problem worse.
Visual Studio’s IDE provides excellent tools for debugging code. In particular, it lets you stop a program
while it is running and see what it’s doing. It lets you follow the program as it executes its code one line
at a time, look at variable values, and even change those values while the program is still running.
The following sections describe some of Visual Studio’s most useful debugging tools.
SETTING BREAKPOINTS
A breakpoint stops code execution at a particular piece of code. To set a breakpoint, open the Code
Editor and click the gray margin to the left of the code where you want to stop. Alternatively, you
can place the cursor on the line and press F9. The IDE displays a red circle to show that the line has
a breakpoint.
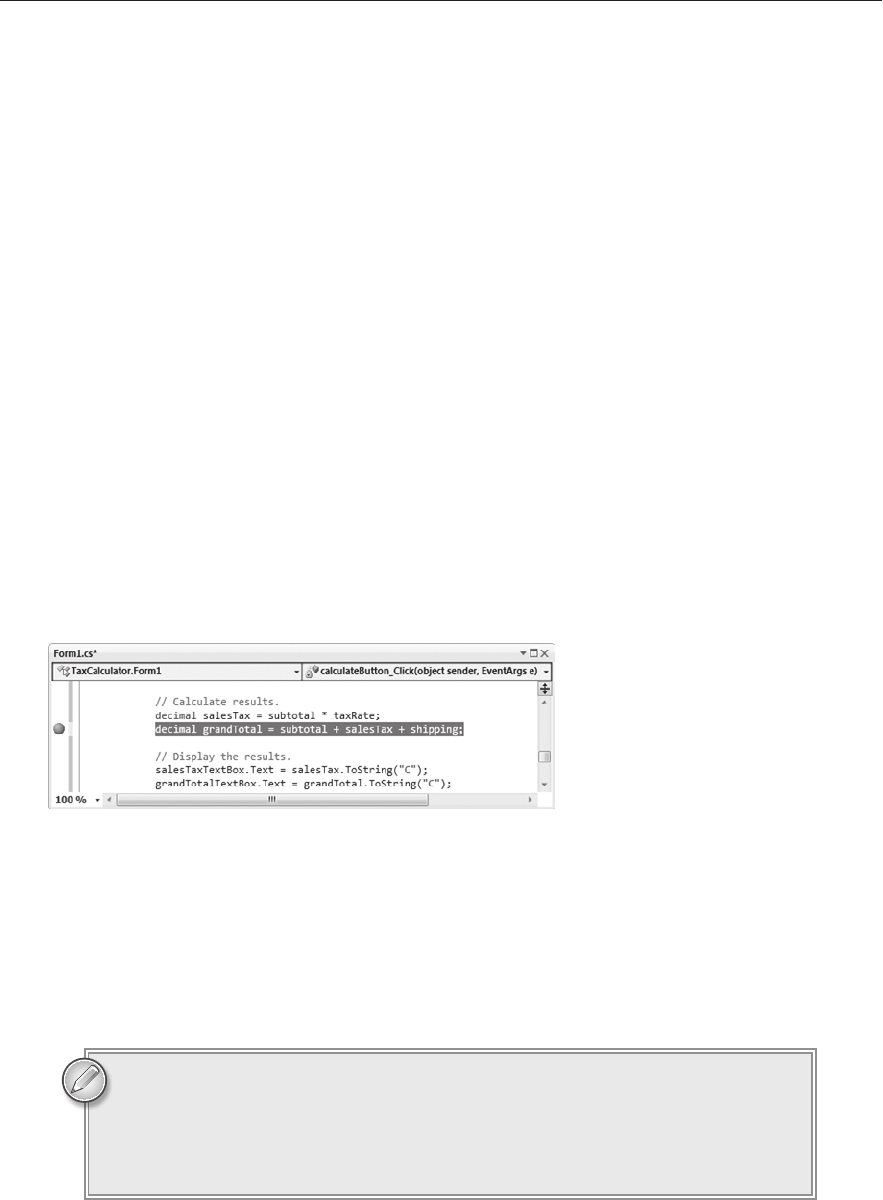
Figure 12-1 shows a breakpoint set on the following line of code:
decimal grandTotal = subtotal + salesTax + shipping;
FIGURE 121
If you run the program now, execution stops when it reaches that line. You can then study the code
as described in the following sections.
The debugger provides an edit-and-continue feature that lets you modify a stopped program’s
code. You can add new statements, remove existing statements, declare new variables, and so forth.
Unfortunately, the debugger gets confused if you make certain changes, and you’ll have to restart
your program. But sometimes you can make small changes without restarting.
Note that edit-and-continue isn’t supported when you’re building a 64-bit
program, but you can test on a 32-bit program built on a 64-bit system. In
Solution Explorer, right-click on the solution and select Properties. Expand the
Configuration Properties folder, select the Configuration tab, and set Platform
to “x86.” After you finish testing, you can switch the program back to 64 bits.
596906c12.indd 152 4/7/10 12:32:40 PM
Reading Variables
153
To remove a breakpoint, click the red breakpoint circle or press F9 again.
SPONTANEOUS STOP
If you need to stop a program while it is running and you haven’t set any breakpoints,
you can select the Debug menu’s Break All command or press [Ctrl]+[Alt]+[Break].
The debugger will halt the program in the middle of whatever it is doing and enter
break mode.
If the Break All command isn’t in the Debug menu (it may not be for some versions
of Visual Studio), you can still use the shortcut [Ctrl]+[Alt]+[Break].
This technique is particularly useful for interrupting long tasks or infinite loops.
READING VARIABLES
It’s easy to read a variable’s value while execution is stopped. Simply hover the mouse over a variable
and its value appears in a popup window.
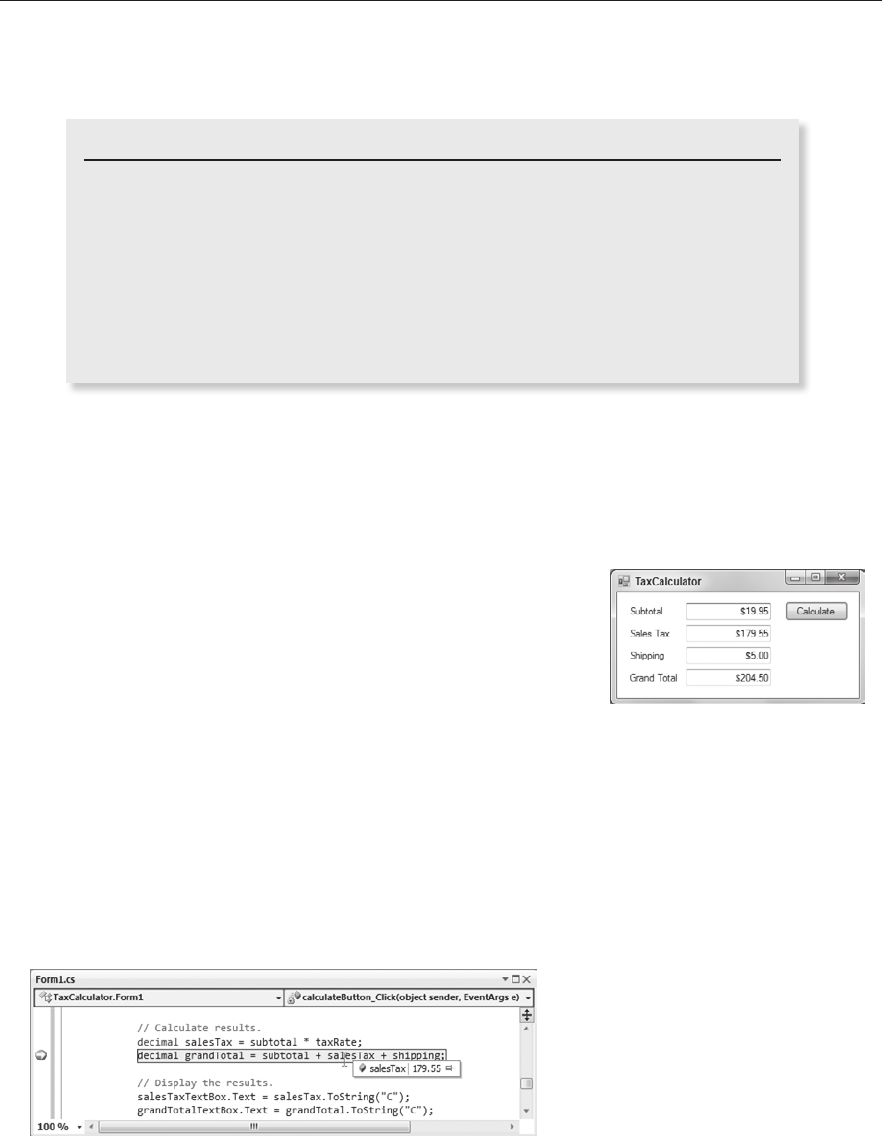
For example, consider the order summary program shown in
Figure 12-2. The program is supposed to add a subtotal, 9% sales
tax, and shipping costs to get a grand total. It doesn’t take Stephen
Hawking to realize that something’s wrong. If you’re really paying
$204.50 for a $19.95 purchase, you need to find a new place to shop.
To debug this program, you could place a breakpoint on a line of
code near where you know the bug occurs. For example, the line
of code containing the breakpoint in Figure 12-1 calculates the
grand total. Because the total displayed in Figure 12-2 is wrong, this seems like a good place to
begin the bug hunt. (You can download the TaxCalculator program from the book’s web site and
follow along if you like.)
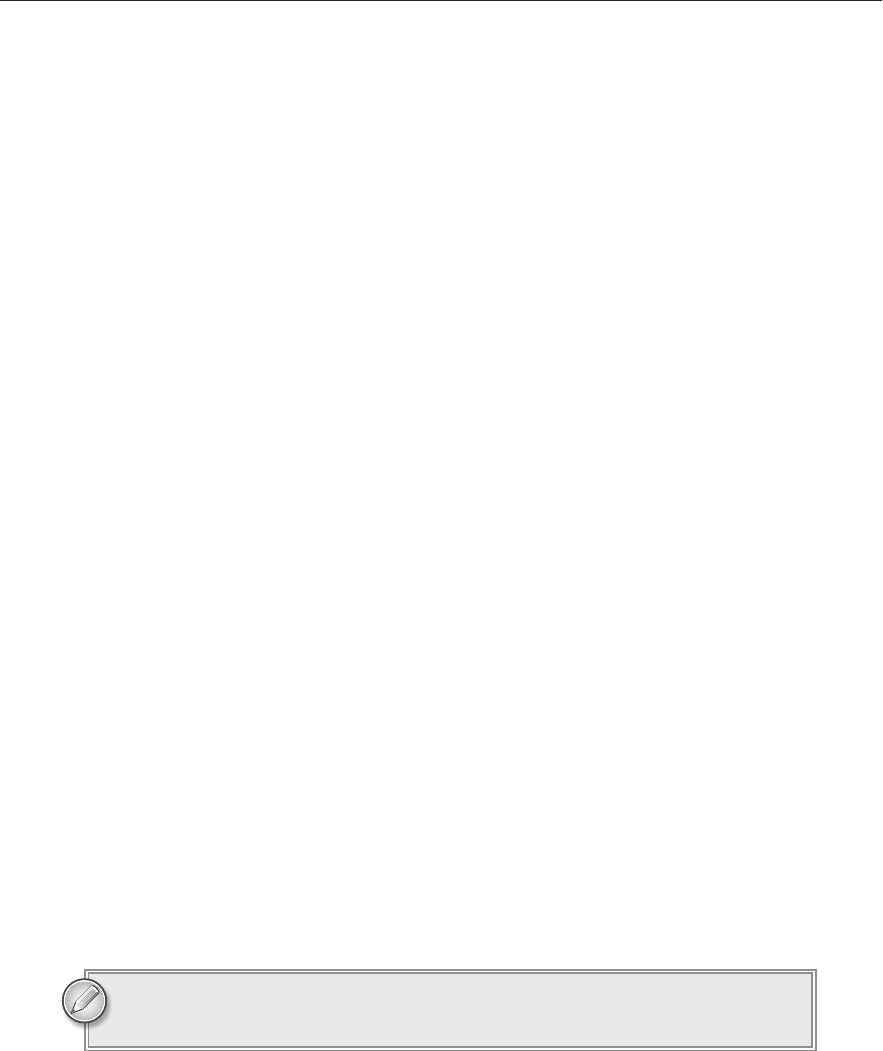
When the code is stopped, you can hover the mouse over a variable to learn its value. If you hover the
mouse over the variables in that line of code, you’ll find that
subTotal is 19.95 (correct), shipping is
5 (correct), and salesTax is 179.55 (very much incorrect). Figure 12-3 shows the mouse hovering over
the
salesTax variable to display its value.
FIGURE 123
FIGURE 122
596906c12.indd 153 4/7/10 12:32:41 PM
154
LESSON 12 Debugging CoDe
Now that you know the bug is lurking in the variable salesTax, you can hover the mouse over other
variables to see how that value was calculated. If you hover the mouse over the variables in the pre-
vious line of code, you’ll find that
subTotal is 19.95 (still correct), and taxRate is 9.
You may need to think about that for a bit to realize what’s going wrong. To apply a tax rate such as
9 percent, you divide by 100 and then multiply. In this case,
taxRate should 0.09 not 9.
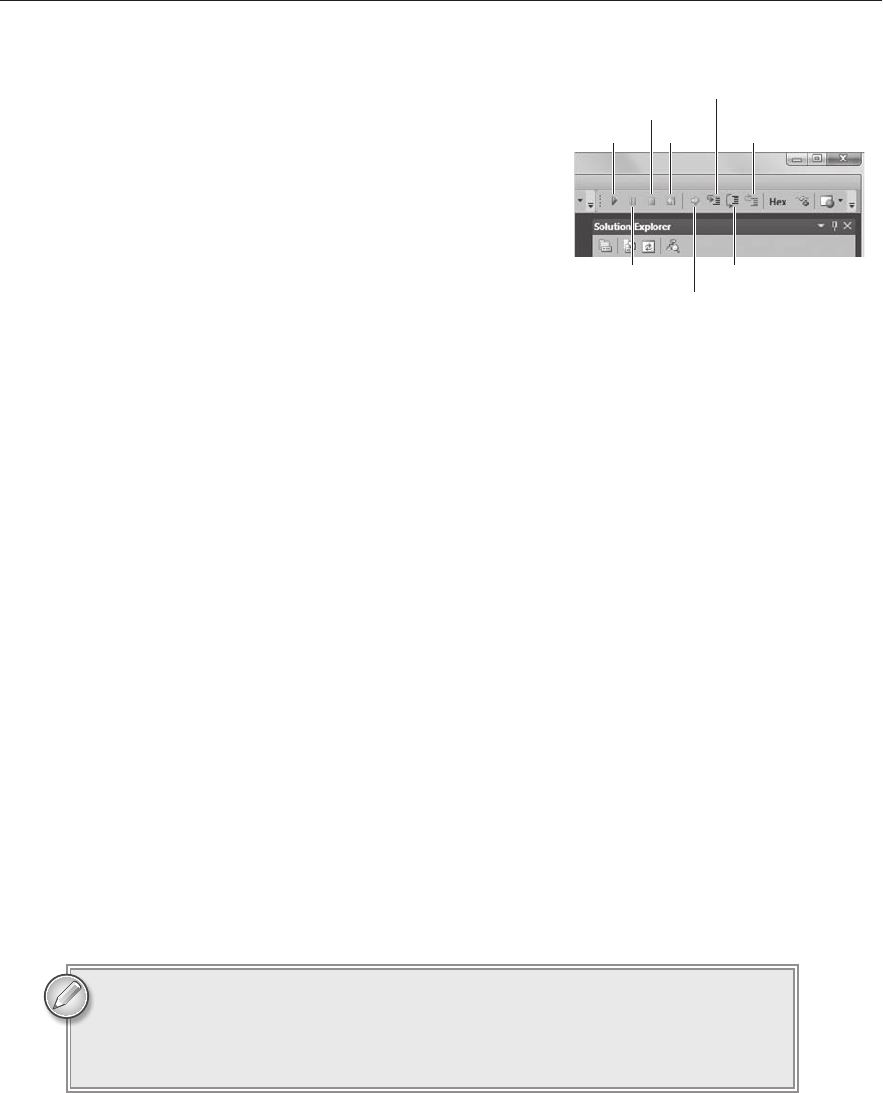
Having figured out the problem, you can stop the program by opening the Debug menu and select-
ing the Stop Debugging command or by clicking the Stop Debugging button on the toolbar (see
Figure 12-4).
Now you can fix the code and run the program again to see if it works. The following line shows the
incorrect line of code (I scrolled it out of view in Figure 12-3 so it wouldn’t be a complete giveaway):
const decimal taxRate = 9M;
When you run the program again, you should get the correct a sales tax $1.80 and grand total
$26.75. In a more complicated program, you would need to perform a lot more tests to make sure
the program behaved properly for different inputs including weird ones such as when the user enters
“ten dollars” for the subtotal or leaves this shipping cost blank. This example isn’t robust enough to
handle those problems.
STEPPING THROUGH CODE
Once you’ve stopped the code at a breakpoint, you can step through the execution one statement at
a time to see what happens. The Debug menu provides four commands that control execution:
Continue (F5)
— Makes the program continue running until it finishes or reaches another
breakpoint. Use this to run the program normally after you’re done looking at the code.
Step Into (F11)
— Makes the program execute the current statement. If that statement con-
tains a call to a method, function, or other executable piece of code (these are covered in
Lesson 20), execution stops inside that code so you can see how it works.
Step Over (F10)
— Makes the program execute the current statement. If that statement con-
tains a call to another piece of executable code, the program runs that code and returns with-
out stopping inside that code (unless there’s a breakpoint somewhere inside that code).
Step Out ([Shift]+F11)
— Makes the program run the current routine until it finishes and
returns to the calling routine (unless it hits another breakpoint first).
When it is stopped, the debugger highlights the next line of code that it will
execute in yellow.
In addition to using the Debug menu or shortcut keys, you can invoke these commands from
the toolbar.
596906c12.indd 154 4/7/10 12:32:41 PM
Using Watches
155
Figure 12-4 shows the toolbar buttons for the Debug menu’s
execution commands.
Normally the program steps through its statements in
order, but there is a way to change the order if you feel the
need. Right-click the line that you want the code to execute
next and select Set Next Statement from the context menu.
Alternatively you can place the cursor on the line and press
[Ctrl]+[Shift]+F10. When you let the program continue, it
starts executing from this line.
Setting the next statement to execute is useful for replaying
history to see where an error occurred, re-executing a line
after you change a variable’s value (described in the “Using the
Immediate Window” section later in this lesson), or to jump
forward to skip some code.
Note that you can only jump to certain lines of code. For example, you can’t jump to a comment
or other line of code that doesn’t actually do anything (you can’t set a breakpoint there either), you
can’t jump to a different method, you can’t jump at all if an error has just occurred, you can’t jump
to a variable declaration unless it also initializes the variable, and so forth. C# does its best, but it
has its limits.
USING WATCHES
Sometimes you may want to check a variable’s value frequently as you step through the code one
line at a time. In that case, pausing between steps to hover over a variable could slow you down,
particularly if you have a lot of code to step through.
To make monitoring a variable easier, the debugger provides watches. A watch displays a variable’s
value whenever the program stops.
To create a watch, break execution, right-click a variable, and select Add Watch from the context
menu. Figure 12-5 shows a watch set on the variable
subtotal. Each time the program executes a
line of code and stops, the watch updates to display the variable’s current value.
The watch window also highlights variables that have just changed in red. If you’re tracking a lot of
watches, this makes it easy to find the values that have changed.
The Locals window is similar to the Watch window except it shows the values
of all of the local variables (and constants). This window is handy if you want to
view many of the variables all at once. It also highlights recently changed values
in red so you can see what’s changing.
FIGURE 124
Continue Restart
Break All Step Over
Stop Debugging
Step Out
Step Into
Show Next Statement
596906c12.indd 155 4/7/10 12:32:42 PM
..................Content has been hidden....................
You can't read the all page of ebook, please click here login for view all page.