
Using Google Statistics
If you look at Figure 9-15, you will see a link on Android Market called Statistics.
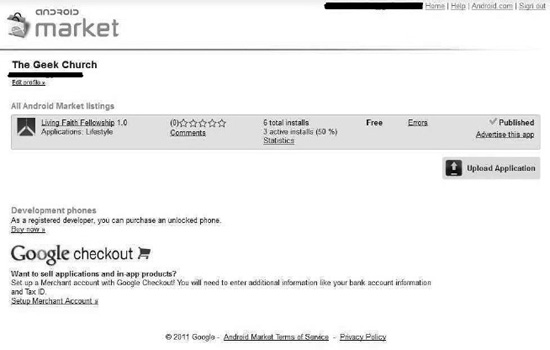
Figure 11-15. The Statistics area can give you vital information about how your application is selling.
The Statistics area shows a lot of useful information, including a graph of total active installs of your app. You will also see attributes breakdown of platform versions in pie chart form, which will show what versions of Android your users are using. It will also show you a pie chart of what specific devices are being used, and what countries and languages your application is being downloaded in.
You can use this information to figure out important information about how your application is progressing. For example, you may notice that your application is not being downloaded on certain models of Android phones. Uh-oh! Does that mean that your application is having problems downloading on that particular type of Android phone? That is most certainly worth looking into. Hopefully, you can use the data to discover problems before your users start complaining about them in the form of negative reviews.
In addition to monitoring how your application is doing on the market, there are other ways you can gain useful knowledge out in the field.