CHAPTER 4
Forward and Futures Interest Rates
People who work with interest rates encounter three fundamental kinds of yield curves. One is a zero-coupon curve that represents the yields used to value single cash flows, which are known as zero-coupon bonds. The second is a coupon yield curve that represents the yields—typically internal rates of return—that are used to value bonds that carry periodic coupons in addition to a final principal amount. The third is a forward rate curve that can be used to compare the value of cash between any two dates. Of the three, the forward rate is the most basic and is the curve from which both the zero-coupon and coupon yield curves can be derived. The forward rate curve contains the building blocks that financial engineers use to construct and price any fixed income product. Throughout the chapters in this book, we will have opportunities to work with all three curves and to understand the relationships between them.1
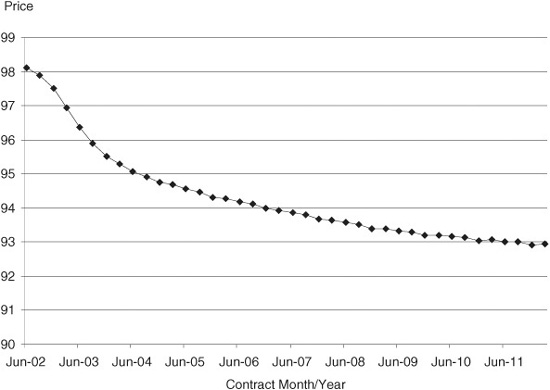
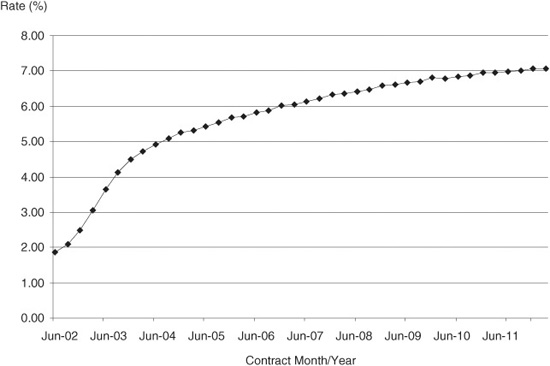
Eurodollar futures are the exchange-traded equivalent of forward borrowing and lending arrangements. In this role, Eurodollar futures provide two things. First, a Eurodollar futures contract’s price, when subtracted from 100, provides an indication of what the forward rate is for the period covered by that particular contract. Second, a Eurodollar futures contract is a tool for locking in synthetically a forward borrowing or lending rate. And, because futures contracts have quarterly expirations going out a full 10 years, we can use them to see the structure of 3-month forward interest rates for a 10-year horizon. Eurodollar futures also can be used to either hedge or construct synthetically any fixed income instrument whose cash flows fall within that 10-year span. Exhibit 4.1 shows Eurodollar futures prices and rates for each of the 40 quarterly contracts on June 17, 2002.
EXHIBIT 4.1
Eurodollar Futures Prices
June 17, 2002
Eurodollar Futures Rates
June 17, 2002
The purpose of this chapter is to lay out the relationship between term and forward deposit rates, explain why Eurodollar futures can be treated like forward rate contracts, and explore some of the uses of forward rates. In particular, in this chapter, you will learn how to:
• Calculate a forward rate from term deposit rates
• Lock in the effective rate on a forward investment using Eurodollar futures
• Determine the fair value of a Eurodollar futures contract
• Calculate richness/cheapness of a futures contract
• Find the break-even conditions for a trade in which you borrow short and lend long
• Find the term deposit curve implied by today’s futures rates
DERIVING A FORWARD RATE FROM TWO TERM DEPOSIT RATES
Suppose you want to lend money for 9 months and know what your total interest income will be at the end of the period. In practice, there are many ways you can do this. For example, you can lend the money at a 9-month term rate that you know today. Or you can lend the money at a 6-month term rate that you know today, and then roll the money plus interest into a 3-month rate.
For you to be indifferent between these two scenarios, you would want to lock in the 3-month rate that will start in 6 months. This rate is the forward rate. The fair value of this forward rate is the value that makes you indifferent between investing at a 9-month term rate versus investing at a 6-month term rate and then reinvesting at the 3-month forward rate.
FIND A 3-MONTH RATE 6 MONTHS FORWARD
A bank wants to lend $1,000,000 for 9 months. It considers two alternatives: 1) lend at the 9-month term rate and 2) lend at the 6-month term rate, and then reinvest the loan plus interest for 3 months.
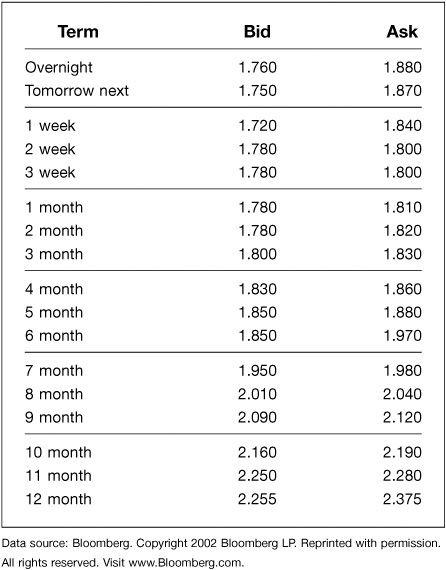
Using the Eurodollar term deposit rate schedule in Exhibit 4.2, on Monday, June 17, 2002, suppose that this bank can lend for 9 months at a rate of 2.12% and for 6 months at 1.97%. At what rate would the bank need to reinvest the money 6 months from now for it to be indifferent between these two lending scenarios?
EXHIBIT 4.2
Eurodollar Deposit Rates
Monday, June 17, 2002
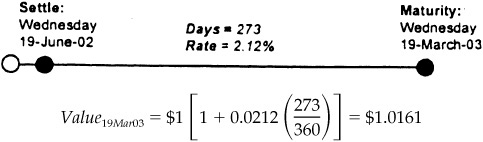
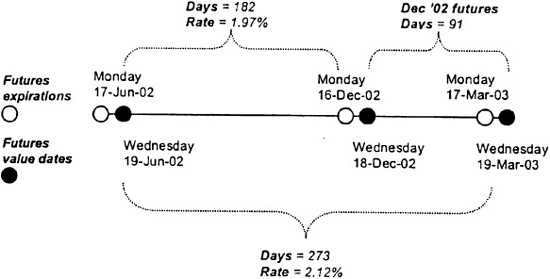
Scenario 1: Lend $1,000,000 for 9 months at 2.12% on Monday, June 17, 2002. The loan settles on June 19, 2002 and matures 9 months later on March 19, 2003. For each dollar lent by the bank, the total amount it will receive on March 19, 2003 is:
Scenario 2: Lend $1,000,000 for 6 months at 1.97% on Monday, June 17, 2002. This loan should mature on Thursday, December 19, but to match the Eurodollar futures value date, we move the maturity to December 18.2 Reinvest the loan plus interest through March 19, 2003.
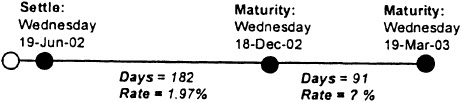
After 182 days, the total amount received for each dollar lent is:
![]()
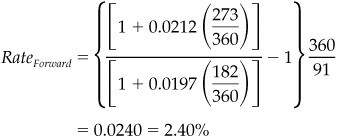
This value is then reinvested for the remaining 91 days, but at what rate? The fair value of this forward rate will make the income produced by Scenario 2 equal to the income produced by Scenario 1.
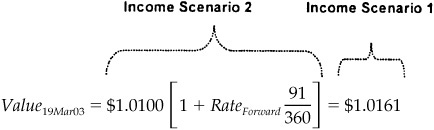
We can then solve for the 3-month rate 6 months forward.
![]()
We have effectively calculated a forward-starting 3-month rate (from December 18, 2002, through March 19, 2003) using only term deposit rates.
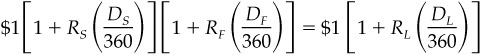
Two generalized equations prove very useful in solving for forward rates using spot deposit rates. Equation 4.1 shows how to combine a short rate with a forward rate to get a long rate. We can then rearrange Equation 4.1 to solve for the forward rate using the short-term and long-term deposit rates (see Equation 4.2).
EQUATION 4.1
Combine a Short Rate with a Forward Rate to Get a Long Rate
EQUATION 4.2
Calculate a Forward Rate from Long and Short Deposit Rates
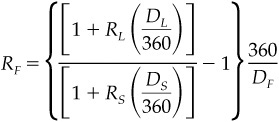
where
RL is the long-term deposit rate
RS is the short-term deposit rate
RF is the forward deposit rate
DL is the number of days in the long term
DS is the number of days in the short term
DF is the number of days in the forward term
FIND A 3-MONTH RATE 6 MONTHS FORWARD (REVISITED)
Calculate a 3-month rate 6 months forward, given the following term deposit rates:
6-month term deposit: 1.97% for 182 days
9-month term deposit: 2.12% for 273 days
The forward 3-month rate covers a 91-day period [= 273 − 182]. Use Equation 4.2 to solve for the forward rate.
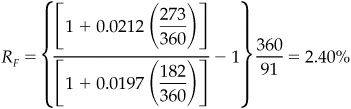
Interim rounding in Example 4.1 accounts for the 1-basis-point difference between the two answers.
LOCKING AN EFFECTIVE FORWARD LENDING RATE USING EURODOLLAR FUTURES
You can use Eurodollar futures to lend or borrow synthetically. In particular, if you combine a long Eurodollar futures contract with a plan to lend money at whatever the market lending rate proves to be when you reach the expiration of the futures contract, the result will look very much like what you would earn on a forward investment at a known forward rate. Similarly, if you combine a short Eurodollar position with a plan to borrow at whatever the market borrowing rate proves to be when you reach futures expiration, the result will be very much like borrowing in the forward market at a known forward rate.
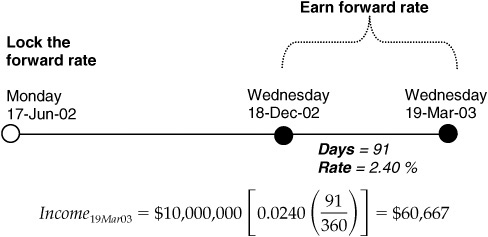
LOCK THE FORWARD LENDING RATE
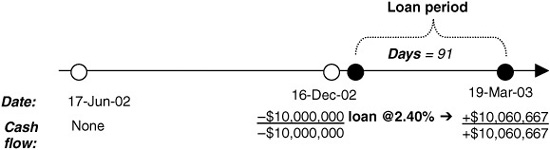
On June 17, 2002, a bank wants to lock in a lending rate on a $10,000,000 3-month loan that will be issued 6 months from now. The lender can either:
1. Lend $10,000,000 at a forward rate of 2.40% or
2. Buy 10 December 2002 Eurodollar futures contracts at 97.60 [= 100 − 2.40] and lend at the prevailing market rate at futures expiration.
The 91-day loan period runs from December 18, 2002, through March 19, 2003 (futures value dates).
Scenario 1: Lock in a forward lending rate of 2.40% on June 17.
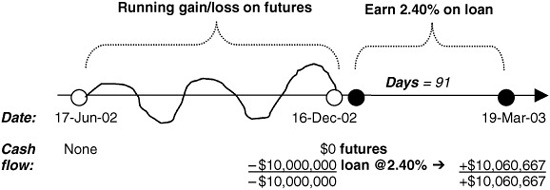
Scenario 2: Buy 10 of the December 2002 Eurodollar futures contract at 97.60, then issue the 91-day loan at the prevailing market rate on December 16, 2002.3
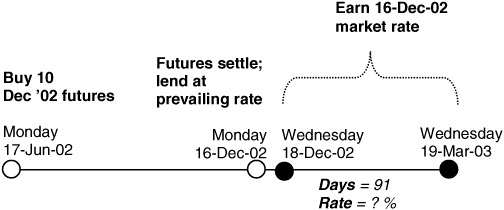
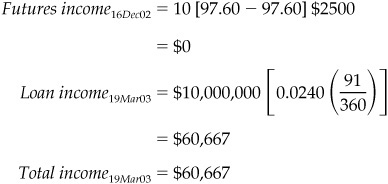
Look at three rate scenarios on December 16, 2002:
a) 3-month LIBOR = 2.40%
December 2002 futures = 97.60 [= 100 − 2.40]
Lender neither pays nor receives variation margin
Lend at 2.40% for 91 days (value date December 18, 2002)
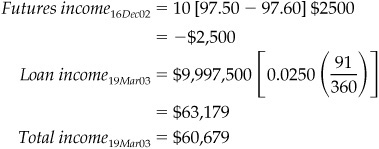
b) 3-month LIBOR = 2.50%
December 2002 futures = 97.50 [= 100 − 2.50]
Lender pays variation margin
Lend at 2.50% for 91 days
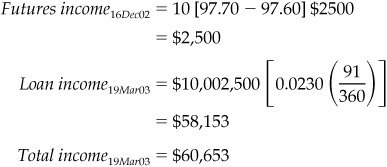
c) 3-month LIBOR = 2.30%
December 2002 futures = 97.70 [= 100 − 2.30]
Lender receives variation margin
Lend at 2.30% for 91 days
By combining a long futures position with a loan issuance at prevailing market rates upon futures expiration, you can make the overall returns immune to changes in interest rates. Under the three rate outcomes in Scenario 2, the returns were just about identical to when we “locked” the forward rate at 2.40%.
Note that buying futures does not fix the rate at which you lend forward. Rather, futures “lock” the rate by compensating you for changes in the market rate: when rates rise (and prices fall), the loss in the long futures is offset by the increase in loan income; when rates fall (and prices rise), the gain in the long futures is offset by the smaller loan income.
IMPORTANT DIFFERENCES BETWEEN FORWARD AND FUTURES MARKETS
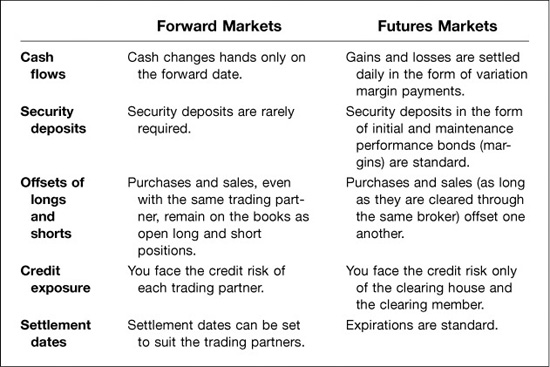
The key differences between borrowing or lending forward and selling or buying Eurodollar futures are these. First, with futures, you must settle all gains and losses on the contracts every day, while with forwards, you carry a sequence of unrealized gains or losses on your forward position until the contract comes due. Second, with futures, you do not know the spread between LIBOR and the rate at which you will borrow or lend until the time comes to actually borrow or lend. For additional differences between forward and futures markets, see Exhibit 4.3.
EXHIBIT 4.3
Key Differences between Forward and Futures Markets
COMPARE FORWARD VERSUS FUTURES CASH FLOWS
Illustrate the cash flows for the two scenarios in Example 4.3.
Scenario 1: Lock the forward lending rate at 2.40% on June 17.
Scenario 2: Buy futures on June 17 and lend at the prevailing market rate on December 16.
a) LIBOR = 2.40%
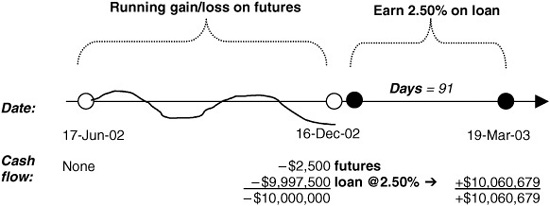
The $2,500 loss on the futures decreases the amount available to loan, but this is offset by the ability to issue the loan at a higher rate.
c) LIBOR = 2.30%
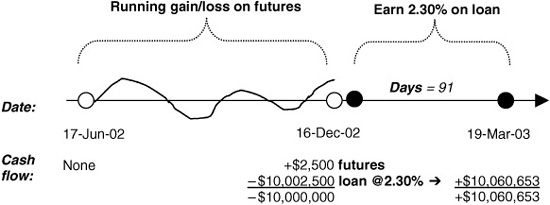
The gain from the futures allows the bank to loan an extra $2,500, but this larger loan is offset by a lower interest rate.
In all three cases, when the bank bought futures and then lent at market rates upon futures expiration, it was able to effectively replicate the cash flows of the locked forward lending.
DETERMINING THE FAIR VALUE OF A EURODOLLAR FUTURES CONTRACT
Once you know that a Eurodollar futures contract can be used to borrow or lend forward synthetically at 3-month LIBOR (plus or minus an appropriate spread), it follows that the fair value of a Eurodollar futures contract’s price is simply 100 less the fair forward value of 3-month LIBOR for the period covered by the contract.
When calculating the fair value of a futures contract’s price, three practical things govern what you do. The first is that the contract settles at expiration to 100 less the value of 3-month LIBOR. As a result, when calculating forward rates, we work with rates on the offered or ask side of the term deposit curve. The second is that the value dates for the rates used to settle the contract have the usual lag of 2 London business days. As a result, the value date for a rate used to settle a contract on Monday would be the following Wednesday, barring any bank holidays. The third is that the term covered by the cash market rate used to settle the contract may be longer or shorter than the period covered by the futures contract.
CALCULATE THE FAIR VALUE OF A EURODOLLAR FUTURES CONTRACT
Use the market data for term deposit rates in Exhibit 4.2 to calculate the fair value of the December 2002 Eurodollar futures contract.
Use term deposit rates and Equation 4.2 to solve for the forward rate.
We convert this forward rate to a futures price by subtracting it from 100. So, the fair value of the December 2002 futures contract is 97.60 [= 100 − 2.40].
The fair value calculation obscures date mismatches between the cash LIBOR and futures markets. We highlight some differences below.
TRACK DATE MISMATCHES BETWEEN THE CASH AND FUTURES MARKETS4
What date mismatches occurred during the calculation of the fair value of the December 2002 Eurodollar futures contract on June 17, 2002?
Futures Value Dates
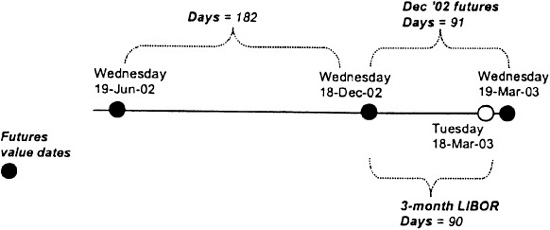
a) Futures market convention is to count the days covered by a futures contract as the days between futures value dates. The December 2002 futures rate, for example, covers the period from Wednesday, December 18, 2002, through Wednesday, March 19, 2003. This 91-day forward period is used in the fair value calculations.
b) The December 2002 futures contract settles to 3-month LIBOR whose value date is Wednesday, December 18, 2002, and whose maturity date is Tuesday, March 18, 2003. This 90-day period is shorter than that covered in the fair value calculation.
c) The forward fair value calculation used 6-month and 9-month LIBOR. The value date for these two deposits was Wednesday, June 19, 2002. The respective maturity dates were Thursday, December 19, 2002, and Wednesday, March 19, 2003. The 6-month maturity date falls 1 day after the futures value date of December 18.
Cash Market Dates

As date mismatches go, the differences are small, and you would not be far wrong if you used 2.40% as the fair value of the forward 3-month LIBOR to which the futures contract settled.
RICHNESS AND CHEAPNESS
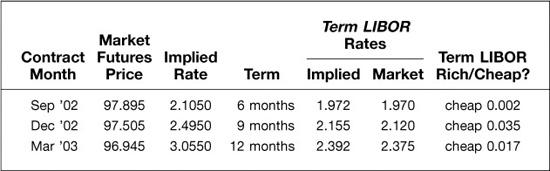
We have calculated the fair forward values of 3-month LIBOR for the first three Eurodollar contracts using the offered term deposit rates provided in Exhibit 4.2. Subtracting these rates from 100 results in the fair futures contract prices shown in Exhibit 4.4. Market futures prices are listed next to the fair prices, and a comparison of the two provides a measure of contract richness or cheapness. For example, the market price of the Sep ′02 contract on June 17, 2002, was 97.895, which was a scant 0.005 below the contract’s fair value. This contract was then trading 0.005 cheap to fair value. The Dec ′02 contract was cheaper, at 0.099 below fair value, while the Mar ′03 contract was trading 0.035 (or 3.5 ticks) rich.
EXHIBIT 4.4
Are Futures Rich or Cheap? June 17, 2002
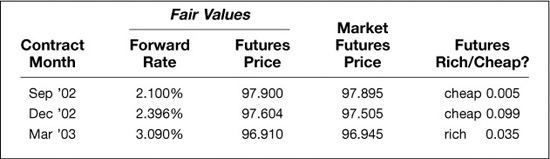
In this example, the relative richness or cheapness of the futures contract is reckoned using the term deposit market as the standard of value. In many ways, since the Eurodollar futures market is considered rightly to be the more liquid and competitive of the two markets, it might make more sense to value the richness or cheapness of the term deposit market relative to the Eurodollar futures market.
To do this, one can calculate the term deposit rates implied by Eurodollar futures rates. This is what we have done in Exhibit 4.5, where we find that the market value of 6-month LIBOR was 1.970 percent, which was 0.002 less than the term deposit rate of 1.972 percent implied by the futures market. The 9-month term deposit rate was 3.5 basis points below its “fair” value, while the 12-month deposit rate was 1.7 basis points below its fair value.
EXHIBIT 4.5
Is Term LIBOR Rich or Cheap? June 17, 2002
FORWARD RATES ARE BREAK-EVEN RATES
A forward rate is the rate at which a yield curve trade will break even. The fact that forward rates are break-even rates is perhaps one of the most powerful practical applications of forward rates.
To see this, consider a standard “positive carry” trade in which a bank borrows money for 3 months and lends it for 6 months.
EVALUATE THE PERFORMANCE OF A “POSITIVE CARRY” TRADE
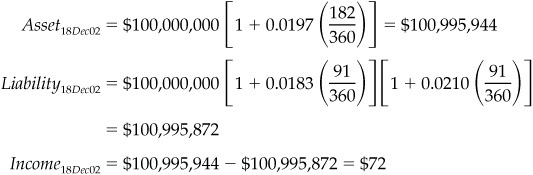
On June 17, 2002, a bank is able to borrow $100,000,000 for 3 months at 1.83% and lend $100,000,000 for 6 months at 1.97%. Because the bank earns 1.97% on its 6-month asset and pays 1.83% on its 3-month liability, it is said to have positive carry.
How will this trade perform if 3 months from now, the 3-month rate:
1. Remains at 1.83%?
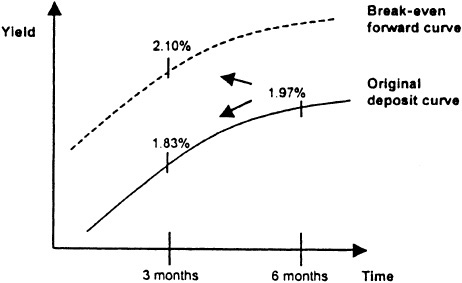
2. Goes to 2.10%, which is the forward rate implied by today’s term deposit rates?
Yield Curves for Roll-Down and Break-Even Scenarios
1. The 3-month rate 3 months from now is 1.83%
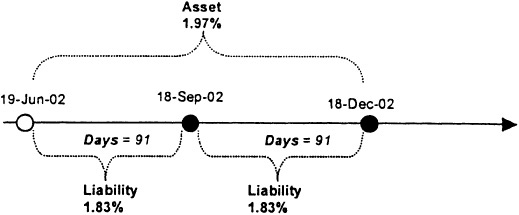
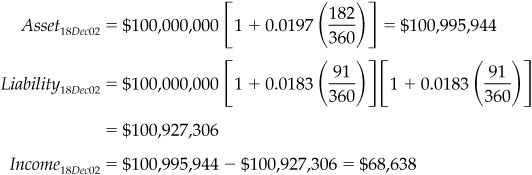
The banker would make $68,638 if the 3-month rate is 1.83% 3 months from now.
2. The 3-month rate 3 months from now is 2.10%
The banker just about breaks even if the 3-month rate 3 months from now is 2.10%.
The refinancing rate at which a trade like this breaks even is the fair value of the forward rate at the beginning of the trade.
Since we know that borrowing short term and lending long term is like being long a forward asset, we know that we should be able to reproduce the gains on this trade by buying an appropriate number of the right Eurodollar contract. In this example, rather than borrowing for 3 months and lending for 6, we can simply buy the Sep ′02 futures contract. To compare the results of the two approaches, we need to compare what the two approaches make on the same day. With the Sep ′02 futures contract, we will know what we have made when the contract expires on September 16, 2002 (value date of September 18). We need, then, a way to find what we have made on the cash and carry trade on that day.
To do this, we need to rearrange the information we used to reckon the gain or loss in December to find the present value of our gain or loss as of September. That is, if we divide the December values of the asset and liability by [1 + Sep LIBOR (Days/360)], we can compare the present value of the long-term asset with the September value of the original 3-month liability. Notice in Example 4.8 that if we do this, we find that the net value of our position would be $68,322, which, as it happens, is simply the present value of the $68,638 that was our net gain in December. That is, $68,322 = $68,638/[1 + 0.0183(91/360)].
PRESENT VALUE THE CASH FLOWS FROM EXAMPLE 4.7
Evaluate the asset and liability from Example 4.7 on September 18, rather than December 18.
To present value the cash flows to September 18, divide the maturity value on December 18 by the invested value of $1 from September 18 to December 18.
1. The 3-month rate in September is 1.83%
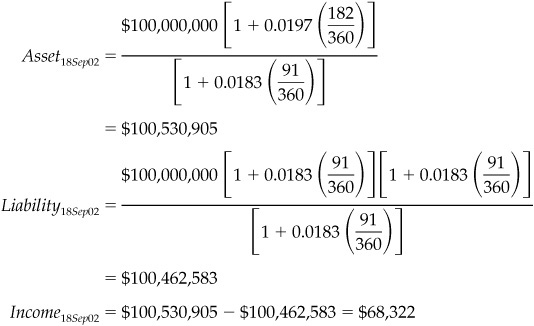
The banker would make $68,322 as of September 18.
2. The 3-month rate in September is 2.10%
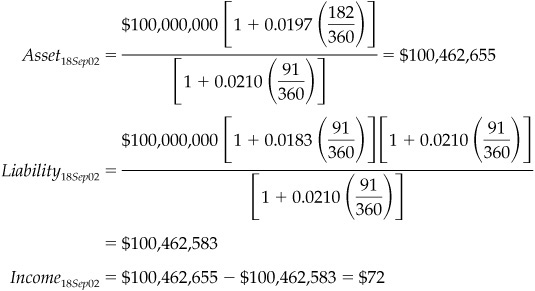
The banker just about breaks even.
Now we are ready to show how a positive carry trade can be replicated with futures.
REPLICATE THE POSITIVE CARRY TRADE WITH FUTURES
Borrowing for 3 months at 1.83% and lending for 6 months at 1.97% on June 17, 2002, is akin to buying September 2002 Eurodollar futures at a fair value of 97.90 [= 100 − 2.10].
How would the futures position perform 3 months later on September 16 (its expiration date) if:
1. The 3-month rate comes in at 1.83%?
2. Futures settle at their fair value of 2.10%?
On June 17:
Buy 101 September 2002 futures at 97.905
On September 16:
1. 3-month LIBOR = 1.83%
September 2002 futures = 98.17 [= 100 − 1.83]
Gain = 101 [98.17 − 97.90] $2500 = $68,175
2. 3-month LIBOR = 2.10%
September 2002 futures = 97.90 [= 100 − 2.10]
Gain = 101 [97.90 − 97.90] $2500 = $0
The futures trade comes very close to matching the cash trade in Example 4.8 under the two interest rate scenarios. The cash trade income was $68,322 when the 3-month rate starting in 3 months was 1.83%. At a rate of 2.10%, the income was $72.
YIELD CURVE TRADES
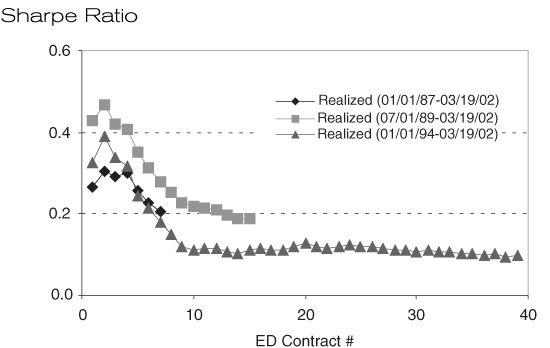
The fact that Eurodollar futures replicate a carry trade provides further insight into the risks and rewards of borrowing short and lending long. Exhibit 4.6 shows the results of simple roll trades in which one buys a Eurodollar contract, holds it for 3 months, and then “rolls” the position into the next contract month. For example, you might buy the contract that is next to expire when it has 3 months to expiration, hold it to expiration, and then replace it with the next contract. On June 17, 2002, this would entail first buying the Sep ′02 contract, holding it until it expires, and then replacing it on September 16 with the Dec ′02 contract, and so forth. This sequence of trades would be like borrowing for 3 months, lending for 6, and then closing out the position every 3 months.
EXHIBIT 4.6
Return by Contract for Simple Buy and Hold Strategies Mean of Return
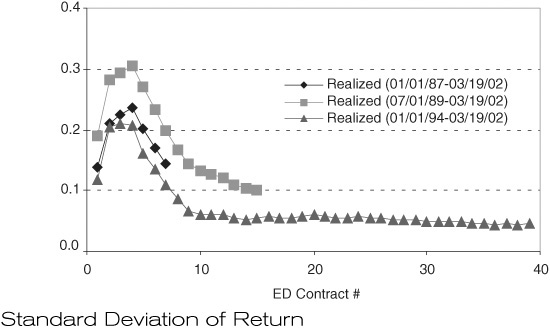
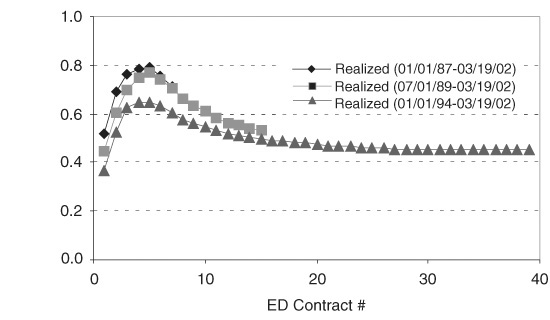
If, instead, we buy the Dec ′02 contract and hold it until September and then replace it with the Mar ′03 contract, and so on, we would be replicating the returns to borrowing money for 6 months, lending it for 9 months, and then closing out this position after 3 months.
FINDING THE FORWARD TERM DEPOSIT CURVE IMPLIED BY TODAY’S FUTURES RATES
Another handy application of forward (futures) rates is in the construction of forward-starting term deposit curves.
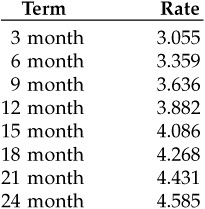
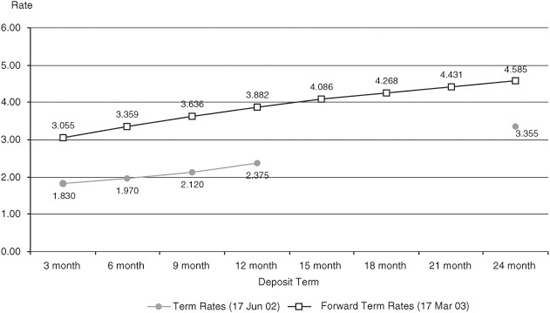
Forward-starting term deposit curves, like the one derived in Example 4.10, are useful in assessing yield curve trades. For example, Exhibit 4.8 shows two term deposit curves—one for today’s spot market and one for the March 17, 2003, forward-starting date. The difference between the two is striking. For example, the 6-month deposit rate on June 17, 2002, was 1.97%. The March 17, 2003, value of the 6-month term rate 9 months forward was 3.359%. From this, we can conclude that any trade whose success depends on the value of the 6-month rate 9 months from now will break even at a rate of 3.359%, which is 139 basis points higher than today’s spot 6-month rate.
EXHIBIT 4.8
Spot and Forward-Starting Term Rates June 17, 2002
FIND A FORWARD-STARTING TERM DEPOSIT CURVE
Use the futures market data on June 17, 2002, to find the forward-starting term deposit curve for March 19, 2003. See Exhibit 4.7 for futures prices and rates.
EXHIBIT 4.7
Eurodollar Futures Prices and Rates
Monday, June 17, 2002
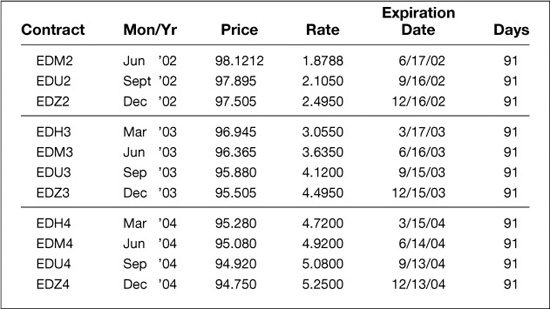
3-month rate: We know that the 3-month deposit for that date is 3.055%, which is simply the March ′03 futures contract rate.
6-month rate: To find the 6-month term deposit rate, we chain together two forward rates—the March ′03 and June ′03 futures rates as follows:
![]()
Solving for Rate6mo, we find that the 6-month deposit rate for our March 19, 2003 forward curve is 3.359%.
9-month rate: The 9-month rate for our forward term deposit curve is 3.636%:
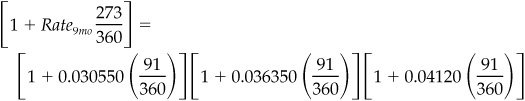
Continuing this process, we find term deposit rates at 3-month intervals for maturities ranging from 3 to 24 months: