
CHAPTER 19
Price, Volatility, and Risk Parameter Conventions
Early on in the life of options on Eurodollar futures, the market gravitated to the idea of thinking about the volatility of the underlying futures rate but quoting the options in terms of price. Thus, the price of a Eurodollar option depends on the distribution of the underlying rate, and the volatilities are quoted as relative rate volatilities. But an option’s strike or exercise price refers to the underlying futures price.
PRICING OPTIONS ON FUTURES
The list of inputs or assumptions required to price an option on a futures contract is shorter than it is for options on spot commodities. With options on spot commodities, one typically needs three pieces of information for the model to calculate the forward price—the spot price, a financing interest rate, and a convenience yield of some sort (e.g., coupon, dividend, deposit rate, etc.). With options on futures, the futures price is the underlying price and is used in lieu of the forward price. Thus, when pricing options on futures, the list of inputs includes:
• Strike price
• Underlying futures price
• Volatility
• Discounting interest rate
where the discounting interest rate is used only to calculate present values.
Consider an example of pricing Sep ′02 Eurodollar calls and puts on the Sep ′02 futures contract on June 17, 2002. The futures price settled at 97.895 on that day, so we will use the 98.00 strike calls and puts in this example, with the calls slightly out of the money and the puts slightly in the money. The discounting interest rate used was 1.879 percent for all of the theoretical calculations. Price and risk information for these options is provided in Exhibit 19.1.
EXHIBIT 19.1
Pricing Sep ′02 Eurodollar Options Closing Values, June 17, 2002 Futures = 97.895; Discounting Interest Rate = 1.879%
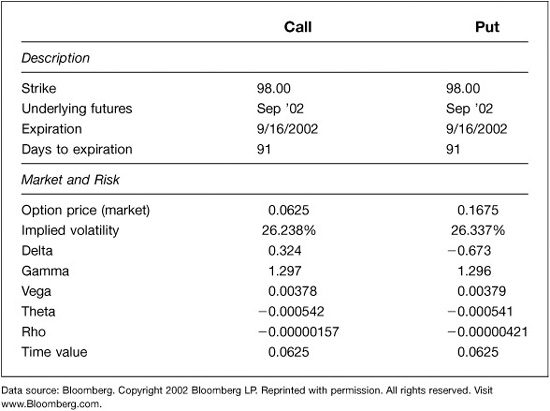
OPTION PRICE (MARKET)
The 98.00 call settled at 0.0625, while the 98.00 put settled at 0.1675. In money, the price of the call would be $156.25 [= 0.0625 × $2500 = 6.25 ticks × $25/tick], and the price of the put would be $418.75 [= 0.1675 × $2500 = 16.75 ticks × $25/tick].
VOLATILITY
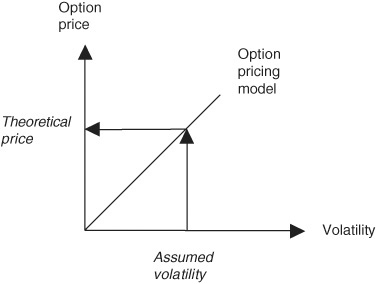
Volatility is used to characterize the variability of the underlying futures contract. It is one of the key inputs to an option pricing model, as shown in Exhibit 19.2. Without volatility in the underlying market, options would have no value apart from their intrinsic or exercise value.
EXHIBIT 19.2
Option Pricing Model Assumed Volatility → Theoretical Price
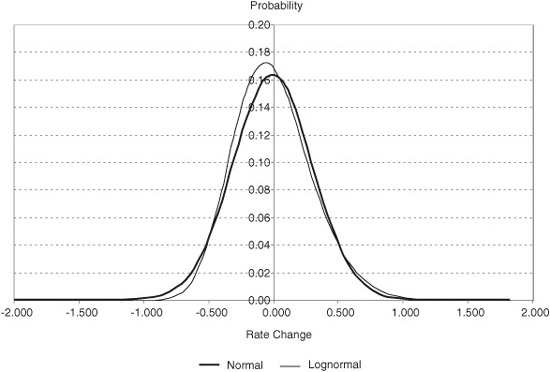
Volatility usually describes the underlying instrument’s relative price changes. In the Eurodollar futures market, however, volatility represents the variability of rate, rather than price, changes. The market quotes volatility on an annualized basis and typically as a percent. In mathematical terms, volatility is defined as the annualized standard deviation of relative rate changes, which are calculated as the natural log of the ratio of one day’s rate to the previous day’s rate. Conventional option pricing models assume—correctly or not—that these relative rate changes are normally distributed and that rate changes are lognormally distributed. Exhibit 19.3 shows a normal distribution of rate changes plotted against a lognormal distribution. Notice that the lognormal curve is bunched on the left and skewed to the right.
EXHIBIT 19.3
Distribution of Rate Changes
Relative Rate Volatility
Estimates of Eurodollar rate volatilities are based on one-day relative rate changes. A one-day relative rate change is calculated as the natural log of the ratio of today’s futures rate to yesterday’s futures rate, which is approximately equal to the one-day change in rates divided by the starting rate. See Equation 19.1 for this approximation.
EQUATION 19.1
One-Day Relative Rate Change
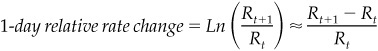
where
Rt is the implied futures rate at time t
Ln is the natural log mathematical function
By convention, volatility represents an annualized standard deviation of daily price or rate changes. In the Eurodollar options market, volatility is quoted as the annualized standard deviation of daily relative rate changes. As shown in Equation 19.2, our practice is to assume that we know the theoretical mean of rate changes (we assume μ = 0 without much worry) and so we divide by the total sample size n. The standard deviation of daily rate changes is then multiplied by the square root of the number of trading days in the trading year. We have some latitude in choosing this number because the number of trading days in a year is somewhat arbitrary. For the sake of writing out Equation 19.2, we have used 256 because it is between 250 (a 52-week working year with a couple of weeks off) and 260 (no time off) and because its square root is 16, which is easy to work with in numerical examples.
Given this approach to measuring Eurodollar volatility, a change in the futures rate from 2.105 percent to 2.205 percent would be 0.0464 [= Ln (2.205/2.105), which is approximately equal to 0.10 percent/2.105 percent], or 4.64 percent. This would annualize to a number like 74.26 percent [= 4.64 percent X ![]()
EQUATION 19.2
Annualized Volatility
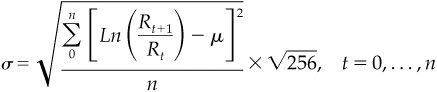
σ is annualized volatility
Rt is the implied futures rate at time t
µ is the theoretical mean
Ln is the natural log mathematical function
n is the number of daily changes in the sample period
256 is the approximate number of trading days in a year
Rate (Basis Point) Volatility
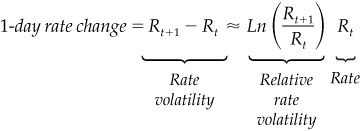
Although it is more common to discuss Eurodollar volatility in terms of relative rate changes, there is a growing body of evidence that supports the idea of working with simple arithmetic rate changes. (See chapter 25, “What Happens to Eurodollar Volatility When Rates Fall?” for more on this point.) These arithmetic changes may be referred to as normalized rate changes or basis point rate changes. Either way, a 1-day rate change is simply the difference in two interest rates as shown in Equation 19.3. Equation 19.3 also shows the relationship between rate changes and relative rate changes.
EQUATION 19.3
One-Day Rate Change
Period Volatility
Because volatility is expressed as an annualized standard deviation, it is often useful to be able to scale it down to suit shorter trading horizons. For one thing, most traders have to mark their books to market at least once a day, so an annualized volatility means nothing. For another, most traded options expire in less than a year, so an annualized standard deviation is really beside the point.
To transform an annualized volatility into a shorter period standard deviation is easy. For example, we can convert an annualized volatility into a 1-day standard deviation by simply undoing the annualizing that was done in the first place. Equation 19.4 shows how this is done. For example, if annualized Eurodollar rate volatility is quoted as 24 percent, the 1-business-day standard deviation or volatility will be 1.5 percent [= 24 percent ![]() . This 1-day volatility or standard deviation is especially useful when evaluating an option trade’s profits and losses. As shown in chapter 21, “Structure and Patterns of Eurodollar Rate Volatility,” a 1-standard deviation change in the underlying rate is just enough for the effects of gamma to offset the effects of theta.
. This 1-day volatility or standard deviation is especially useful when evaluating an option trade’s profits and losses. As shown in chapter 21, “Structure and Patterns of Eurodollar Rate Volatility,” a 1-standard deviation change in the underlying rate is just enough for the effects of gamma to offset the effects of theta.
EQUATION 19.4
Calculate Period Standard Deviations from Annualized Volatility
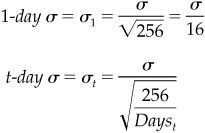
where
σ is annualized volatility
Dayst is the number of trading days in the period
256 is the approximate number of trading days in a year
We can use the same approach to calculate a longer period volatility. The only difference is that we divide the annualized standard deviation by the square root of the number of periods of that length in the trading year. For example, if we wanted to calculate the 1-week value of 24 percent volatility, we would get something like 3.35 percent ![]() , which is percent roughly the equivalent of dividing 24 percent by the square root of the number of weeks in the year.
, which is percent roughly the equivalent of dividing 24 percent by the square root of the number of weeks in the year.
Once we know how to calculate a standard deviation for any time period, it is easy to find basis point volatility over the same period. We can get to basis point volatility by multiplying period volatility times the futures rate, as shown in Equation 19.5.
EQUATION 19.5
Basis Point Volatility over Time Period t
Basis point volatilityt = σt × Rt
where
σt is the standard deviation for time period t
Rt is the futures rate at time t
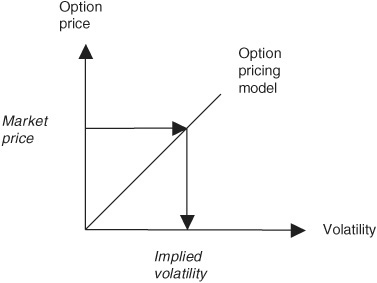
IMPLIED VOLATILITY
Implied volatility is the level of volatility that sets the theoretical option price equal to the market option price. It is a measure of how volatile the futures rate is expected to be over the remaining life of the option. If we input a market option price to the option pricing model, the model returns an implied volatility, as illustrated in Exhibit 19.4.
EXHIBIT 19.4
Option Pricing Model Market Price → Implied Volatility
We will now interpret the implied volatilities for our 98.00 strike call and put options. The implied volatilities were 26.238 percent and 26.337 percent, respectively, which are the results of finding theoretical call and put prices that would equal their market prices. These volatilities are relative interest rate volatilities rather than the relative price volatilities. With an implied futures rate of 2.105 [= 100.000 − 97.895], a relative rate volatility of 26.238 percent would correspond to an annualized rate volatility of 0.552 [= 0.26238 × 2.105], or 55.2 basis points.
RISK PARAMETERS
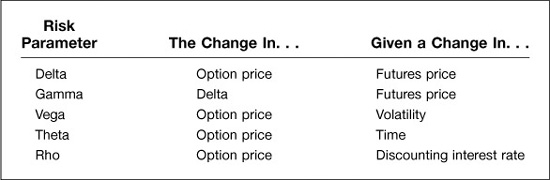
Risk parameters are used to describe an option’s sensitivity to market or time changes. The risk parameters delta, gamma, vega, theta, and rho are summarized in Exhibit 19.5 and described in detail below.
EXHIBIT 19.5
Summary of Risk Parameters
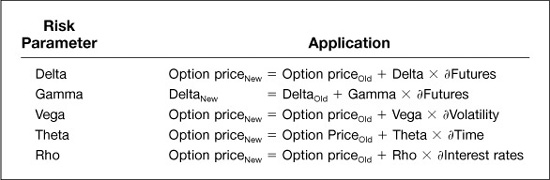
Application of Risk Parameters
For Small Changes in Market Conditions
Delta
An option’s delta is the approximate change in the option’s price given a small increase in the underlying price. The delta of the 98.00 call, which is slightly out of the money with futures at 97.895, is 0.324 and is shown in Exhibit 19.1 as positive. With this delta, if the underlying futures price were to increase 10 ticks, the call price would increase approximately 3.24 ticks [= 0.324 × 10 futures ticks]. The 98.00 put’s delta is shown as −0.673, which indicates that if the underlying futures price were to increase 10 ticks, the put price would fall approximately 6.73 ticks [= –0.673 × 10 futures ticks].
Notice that even though the driving force behind the options is the variability of interest rates, the option is still on the future’s price rather than the rate, and the options’ deltas are defined in terms of changes in the underlying Eurodollar futures price.
Gamma
Gamma is the change in the option’s delta given a change in the underlying futures price. It is always positive for a long option. The 98.00 call has a gamma of 1.297. With a 10-tick increase in the futures price from 97.895 to 97.995, the call’s delta increases from 0.324 to 0.4537 [= 0.324 + 0.10 × 1.297]. This makes sense because the call is closer to the money at the higher futures price. The 98.00 put has a gamma of 1.296. With a 10-tick increase in the futures price, the put’s delta becomes less negative as it changes from –0.673 to –0.5434 [= –0.673 + 0.10 × 1.296]. The higher futures price makes the put less in the money.
Vega
Vega is the increase in the option’s price given a 1-percentage-point increase in volatility. In this case, if volatility were to increase from 26.238 percent to 27.238 percent, the call’s price would increase by 0.00378. The put’s sensitivity to a change in implied volatility is almost exactly the same. The units of vega are price points.
Theta
Theta measures the rate at which the option’s price falls with the passing of time. With a theta of −0.000542, a 5-day passage of time would cause the call option’s price to fall by about 0.00271 [= 0.000542 × 5]. The units of theta are price points.
Notice that the theta of the put is ever so slightly smaller (in absolute value) than it is for the call. This is because the passing of time has two effects on the price of an option. One is a fall in the value of the option because the passing of time reduces the range of things that can happen to the underlying rate by the time the option expires. The other is an increase in the present value of the option because the discounting horizon is growing shorter. This is a comparatively small effect in most cases, but because the put’s price is larger than the call’s price, the present value effect is larger. As a result, the net rate of time decay for the put is slightly smaller than it is for the call.
Rho
Rho measures the effect of a change in the financing or discounting interest rate on the price of the option. With options on spot commodities, a change in this rate affects the option’s price for two reasons. First, if one is holding the spot price of the commodity fixed, an increase in the financing rate will increase the commodity’s forward price and will, as a result, increase the price of a call and decrease the price of a put. Second, an increase in the interest rate decreases all present values. As a result, if the option is priced to be paid in cash, then an increase in the discounting interest rate will reduce the option’s price.
With options on futures, you increase this rate while assuming that the futures price is fixed. Thus, the only thing that can happen is that the present value of the option, and hence its price, falls. This is true both for the call and for the put. As shown in Exhibit 19.1, the call option’s rho is −0.00000157, while the put option’s rho is −0.00000421. The put’s rho is, in absolute terms, larger than the call’s rho because the put’s price is higher than the call’s and so, as a result, are any present value effects.
Generally, in our own risk reports, we omit values for rho because they tend to be very small relative to those for delta, gamma, vega, and theta.
Intrinsic and Time Value
The option’s time value is its price net of any exercise or “intrinsic” value. The call option is out of the money so its entire price of 0.0625 is time value. The put is 0.105 points in the money, so its time value is also 0.0625 [= 0.1675 − 0.1050].