CHAPTER 11
Measuring and Trading Term TED Spreads
SYNOPSIS
The spread between Treasury and Eurodollar rates, which we know as the TED spread, has been a staple trade in the futures markets ever since the Eurodollar contract was listed in 1981. As a measure of the credit spread between high-grade bank debt and Treasury debt, the TED spread often has responded sharply to financial crises that have threatened to harm the credit quality of the banking system.
Although the world has become less skittish over the years and tends to react less violently to financial crises than it once did, the basic TED spread is still an active part of the trading scene. And over the past several years, the trade has extended into more sophisticated territory. The original TED was simply the spread between the price of a Treasury bill futures contract and the price of a Eurodollar futures contract. Now we find a growing interest in trading Treasury notes (or note futures) against strips of Eurodollar futures. We call these term TED spreads.
The basic TED spread is the easiest thing in the world to trade. Because a basis point is worth a flat $25 for both Treasury bill and Eurodollar futures contracts, buying the TED spread involves nothing more than buying Treasury bill futures and selling an equal number of Eurodollar futures in the same contract month.
Term TED spreads, however, are trickier both to measure and to trade, and the purpose of this note is to lay out as neatly as we can the various ways of approaching the trade. In the process, we show that simple zero-coupon (unweighted) measures of the spread are sensitive to changes in the slope of the yield curve while coupon (weighted) measures of the spread are not, and we show how to construct the two kinds of trades correctly. We show that the trade is not as directional as a lot of traders think. We show that measures of term TED spreads can be very sensitive to seemingly innocuous assumptions or mistakes that one might make when dealing with Eurodollar and Treasury markets. We also discuss in some detail the choices that traders can make when dealing with exposure to the “stub” rate and the consequences of the choices they make.
I should mention that this note is not as imposing as its size might make it seem. The main body of the note is comparatively short and contains most of what a trader needs to know about how term TED spreads are measured and traded. The technical appendix, on the other hand, is a hefty piece of work that contains everything anyone might want to know about the intricacies of relating markets for coupon-bearing notes and bonds to the Eurodollar futures market. As such, it will serve as a technical document for anyone who wants to know how to reconcile settlement dates and date mismatches in different markets, and how to calculate hedge ratios.
TED SPREADS
The spread between Eurodollar and Treasury rates has been one of the great staples of trading ever since the Eurodollar futures contract was listed in 1981. As a measure of the difference in credit quality between prime London banks and the U.S. Treasury, the TED spread has widened with each new financial crisis and narrowed as fears have died down. As shown in Exhibit 11.1, the TED spread has become much less volatile than it once was, but it is still an actively watched measure of the credit quality of the banking system.
EXHIBIT 11.1
History of the TED Spread, 1970–1995
3-Month LIBOR Less 3-Month Treasury Bill Rate

Simple TED Spreads
From the outset, the most actively traded TED spread has been the difference between the Treasury bill and Eurodollar (ED) futures prices. Because of the way these two contract prices are quoted,
Treasury bill futures price = 100 − 3-month Treasury bill rate
ED futures price = 100 − 3-month ED rate
The spread between the T-bill and Eurodollar futures prices is the difference between the market’s expectations of 3-month LIBOR and the 3-month Treasury bill rate as of the expiration of the futures contract. That is,
Bill futures price − ED futures price = 3-month ED rate − 3-month bill rate
This is a very simple trade to execute because the value of a basis point is $25 for both of these contracts. Therefore, if you think the TED spread will increase, you can simply buy Treasury bill futures and sell an equal number of Eurodollar futures, and the value of a basis point change in the spread will be $25 times the number of spreads. For example, if you buy 100 T-bill futures and sell 100 Eurodollar futures, each basis point increase in the TED spread will produce a gain of $2,500.
Term TED Spreads
Over the past several years, the market has taken an interest in the spread between longer-term Treasury and Eurodollar rates. These spreads are known generally as term TED spreads, and Exhibit 11.2 shows how the 2-year TED spread has behaved over the past several years. Given their volatility, these are highly tradable spreads. But unlike the simple TED spread between Treasury bill and Eurodollar futures prices, term TED spreads are both harder to measure and harder to execute properly.

TWO KINDS OF TERM TED SPREADS
While everyone computes Treasury yields using well-accepted standards, there are several ways to compute the yield on the Eurodollar side of the spread. The two most widely used measures of the Eurodollar yield are those that use a zero-coupon rate and those that make an effort to translate Eurodollar futures rates into a yield on a coupon bearing instrument. We will refer to the first of these as unweighted Eurodollar strip yields and the second of these as weighted Eurodollar strip yields.
Unweighted Eurodollar Strip Yields versus Treasury Yields
This form of the term TED spread is easy to calculate and easy to trade. In its most basic form, a Eurodollar strip yield is simply the bond equivalent yield on a zero-coupon bond where the price of a $1 zero-coupon bond is
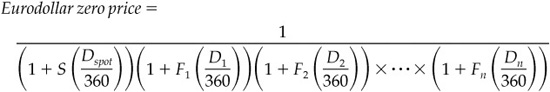
In the denominator is the amount to which $1 would grow at maturity if invested at today’s spot rate, S, and Eurodollar futures rates, Fi. The weights given these rates are the days in their respective periods, Di. Because most Eurodollar futures contracts cover a 91-day period, this calculation gives nearly equal weight to each rate.1
This method has one important shortcoming: it produces term TED spreads that are sensitive to changes in the slope of the yield curve. If one calculates the present value of a coupon bearing note using Eurodollar futures rates, it is easy to see that the note’s present value or price is more sensitive to changes in the nearby rates than to changes in more distant rates.

In this expression, the nearby futures rates (for example, F1 and F2) appear in all of the present value calculations, while the more distant rates (for example, F8) appear only in the calculation of later cash flows. Because of this, one can imagine a simple rotation of the forward rate curve that would have no effect on the price of a zero-coupon note (for example, raising the first two futures rates 10 basis points and lowering the last two futures rates 10 basis points) but that would lower the price of a coupon note. Such a rotation would have no effect on an unweighted Eurodollar strip yield but would increase the yield on a coupon bearing note.
Weighted Eurodollar Strip Yields versus Treasury Yields
To produce measures of the term TED spread that depend only on the credit spread and not on the slope of the yield curve, one must find a way to give greater weight to nearby futures rates and less weight to the more distant futures rates. We calculate two such measures. One is the spread between implied Eurodollar yields and Treasury yields. The other is the fixed basis point spread against Eurodollar rates needed to reconcile Eurodollar rates with Treasury note prices.
Implied Eurodollar Yield versus Treasury Yield
This approach to measuring the spread begins by finding what the note would yield if it were issued by a bank of LIBOR quality. We call this the implied Eurodollar yield. From this we subtract the note’s actual yield to produce the spread.
The implied Eurodollar yield on the note is found by calculating the present value of the Treasury note’s cash flows using discount factors derived from spot LIBOR and Eurodollar futures rates and then finding the note’s yield at that present value. Because Eurodollar rates are higher than corresponding Treasury yields, the present value of the note at these rates is lower than its full market price, and the implied Eurodollar yield is higher than the note’s actual market yield. When measured this way, the term TED spread is expressed as a semiannual bond equivalent yield.
Fixed Basis Point Spread to Eurodollar Futures Rates
Another way to give greater weight to nearby futures rates when computing the term TED spread is to answer the question “What fixed number of basis points must be subtracted from each Eurodollar futures rate to produce a present value of the Treasury note that is equal to its actual full market price?” When measured this way, the spread is expressed in quarterly money market basis points, which uses an Actual/360 day-count convention.
Complete operating instructions for calculating the different measures of the term TED spread are provided in the technical appendix, which covers day-count conventions, date mismatches, and various other real-world headaches that make life in the markets so interesting.
HOW DO THESE RATES COMPARE?
The three approaches to reckoning the term TED spread are illustrated in Exhibit 11.3, which provides on-the-run 2-year and 5-year spreads for June 5, 1995. Exhibit 11.4 provides a history of all three measures of the 5-year term TED spread since September 1993.
EXHIBIT 11.3
Term TED Spreads
June 5, 1995
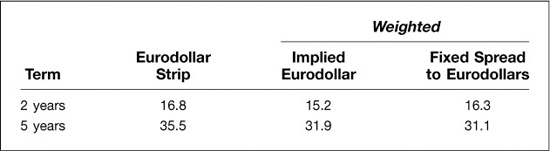
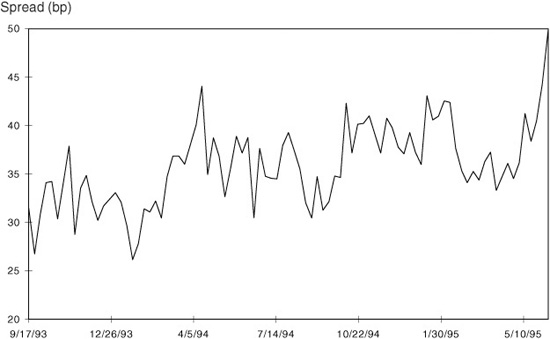
EXHIBIT 11.4
5-Year Term TED Spreads
September 1993 through May 1995

The differences between the three measures of the spread have two main causes. First, as shown in Exhibit 11.4, the Eurodollar strip measure of the spread can be quite a bit larger than either of the other two measures. When the yield curve is positively sloped, the Eurodollar strip yield is higher than the implied Eurodollar yield because relatively greater weight is given to the higher rates found on the more distant parts of the forward rate curve. This is the same effect as zero-coupon bonds yielding more than coupon bonds when the yield curve is positively sloped.
This difference is illustrated more forcefully in Exhibit 11.5, which charts the difference between the Eurodollar strip and implied Eurodollar measures of the 5-year term TED spread (on the vertical axis) against the slope of the yield curve as measured by the difference between the fifth year and lead Eurodollar futures rates (on the horizontal axis). Notice that when the yield curve is steep, the difference between the unweighted and weighted measures of the spread is quite large. When the yield curve is nearly flat, on the other hand, the difference between the two measures is almost zero. And, if the yield curve were to invert, the Eurodollar strip rate version of the spread would actually be smaller than that given by the implied Eurodollar yield spread.
EXHIBIT 11.5
Effect of Yield Curve Slope on the Difference between Unweighted and Weighted TED Spreads (5-Year)

The chief lesson here is that if one wants to trade the straight credit spread between Eurodollar futures and Treasury notes, without interference from the slope of the yield curve, one should focus on term TED spreads that give appropriately greater weight to the nearby contracts.
A second difference between the spreads stems from Treasury issues that have so-called bad dates. Some Treasury notes have coupons or principal payments that are scheduled to fall on weekends or holidays. In these cases, the actual cash payments are made on the first following business day. This is a well known problem in the Treasury market, and the effect of delaying these cash payments is to lower the price of the note. Because the note’s yield is calculated without regard to these delays, however, its yield will appear to be higher than it really is. The swap market compensates for this effect, which can be worth as much as 1.5 basis points or more, by reducing the quoted swap spread over Treasuries if the relevant on-the-run note has bad dates. The way we calculate the implied Eurodollar/Treasury spread produces the same effect, so this measure of the term TED spread is the best for making comparisons between term TED spreads and swap spreads.
In contrast, we calculate the fixed basis point spread to Eurodollars version of the spread assuming that all of the Treasury note’s cash flows fall on actual business days. As a result, the fixed basis point spread to Eurodollars version is perhaps the cleanest version of the pure credit spread. It is not influenced by the slope of the yield curve, and it is not confused by bad dates. On the other hand, it does not lend itself as well to comparisons with swap spreads, which are influenced by the timing of cash flows on the Treasury note.
HOW DIRECTIONAL IS THE SPREAD?
There is a strong sense among traders that the term TED spread is highly directional. This view is seemingly borne out in Exhibit 11.6, which charts the value of the 2-year term TED spread against the yield on a 2-year Treasury note. On average, this spread has been comparatively wide when note yields have been high and comparatively narrow when note yields have been low. A closer examination of the relationship suggests, however, that term TED spreads are much less directional than Exhibit 11.6 seems to imply.
EXHIBIT 11.6
2-Year TED Spread versus 2-Year Note Yield 1989 through 1995
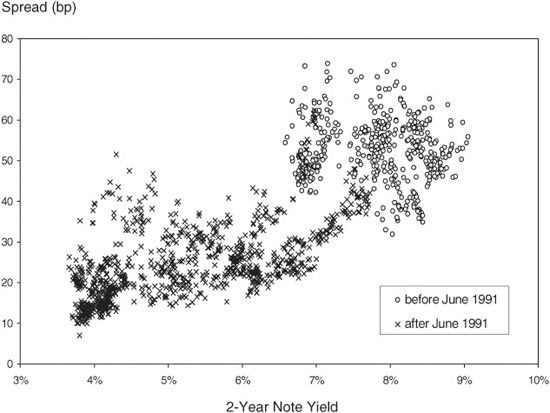
Notice first how the observations are clumped. If you focus on the period before June 1991, when 2-year note yields were trading between 6.50 percent and 9.00 percent, the values of the term TED spread (which are shown as circles) seem to be more or less randomly scattered. Or if you focus on the period after June 1991, when 2-year note yields were trading in a much lower range, the values of the term TED spread seem again to be more or less randomly scattered.
The lack of any significant directional relationship between the size of the spread and the level of note yields is driven home even more forcefully in Exhibit 11.7, which shows 1-month changes in the value of the 2-year term TED spread against 1-month changes in the level of 2-year Treasury note yields. If you look hard enough, you can see a slight positive relationship, but any trades based on this kind of relationship would be subject to a lot of noise.
EXHIBIT 11.7
Change in 2-Year Term TED Spread versus
Change in 2-Year Treasury Yield
Monthly Intervals, May 1989 through May 1995

TRADING THE SPREADS
How you trade the spread depends entirely on how you measure the spread. Suppose that on June 5, 1995, you think that the 2-year term TED spread is too narrow and will widen. To take advantage of this market view, you might buy $100 million face value of the current on-the-run 2-year Treasury note, which is the 6-1/8s of 5/31/97, and sell an appropriately weighted strip of Eurodollar futures.
Just what constitutes an appropriately weighted strip of futures depends, however, on which version of the TED spread you want to trade. Whatever your approach to the trade, you want a position whose P/L can be explained by changes in your measure of the spread. For example, if you want to trade the Eurodollar strip measure of the spread, you want a position that will make money when this measure of the spread widens and will lose money when it narrows. Because the Eurodollar strip measure of the spread is sensitive to changes in the slope of the yield curve, you want your trade’s P/L to have the same sensitivity. On the other hand, if you just want to trade the credit spread, you want a trade construction that is insulated from changes in the slope of the yield curve.
Hedge Ratios
The appropriate Eurodollar combinations for the unweighted and weighted measures of the spread are shown in Exhibit 11.8, both for the trade date of June 5 and one week later (assuming rates unchanged). Consider first the difference between the unweighted and weighted hedge ratios for June 5. In both cases, the total number of contracts is either 771 or 772 (depending on how you round) because the hedges were designed to keep the trade direction neutral.
EXHIBIT 11.8
Eurodollar Futures Hedge Ratios for a
2-Year Term TED
$100 Million of the 6-1/8s of 5/31/97
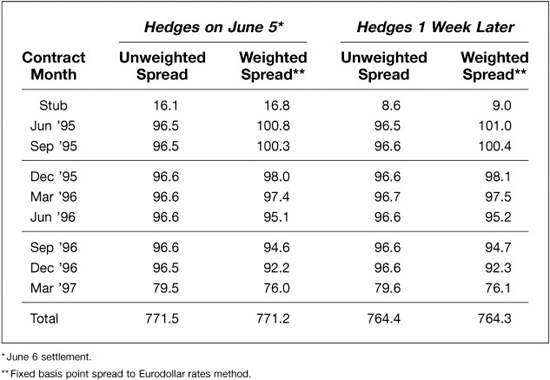
The allocation of contracts across contract months, however, is very different. If you are trading the Eurodollar strip version of the spread, the interest rate on the Eurodollar leg of the spread is the yield on a zero-coupon note. Because there is only one cash flow on a zero-coupon note, the present value of that cash flow depends equally on the futures rates that make up its term discount factor. As a result, the appropriate hedge for this version of the spread gives equal weight to each of the contracts. The main exceptions to this rule stem from differences in the days covered by each of the contracts. For example, Eurodollar futures periods may include as many as 98 days or as few as 84 days, and our calculated hedge ratios will reflect these differences. Also, the last contract in the strip is almost always an exception because it is being asked to cover only the number of days from its corresponding value date to the maturity of the note.
If you are trading either of the weighted versions of the spread, then the hedge is designed to give a weight to each contract that is proportional to the effect of its rate on the value of the note. Because nearby futures rates have a greater effect on the price of a coupon bearing note than do more distant futures rate, we give relatively greater weight to the nearby contracts.
The two sets of hedge ratios are designed to perform differently because of the differences in the way the unweighted and weighted TED spreads are calculated. We know that the Eurodollar strip version of the spread is sensitive to changes in the slope of the forward rate curve. An equally weighted strip of Eurodollar futures captures this effect by giving too little weight to the front contracts and too much weight to the back. As a result, a flattening of the forward rate curve will decrease the price of the coupon bearing Treasury note relative to the price of the corresponding zero-coupon note, which is represented by the Eurodollar strip. The resulting loss should track the decrease in the Eurodollar strip measure of the TED spread.
In contrast, if you want to focus only on the value of the credit spread, you want to sell more of the nearby Eurodollar contracts and fewer of the more distant contracts. For the trade on June 5, the correct numbers of contracts are shown in the weighted term TED spread column of Exhibit 11.8. Anyone who trades swaps against Eurodollar futures recognizes this kind of weighting scheme. When constructed this way, the trade captures only changes in the credit spread and is largely insulated from changes in the slope of the yield curve.
What to Do with the Stub
How you handle exposure to the stub rate depends on how you handle the financing of your note position. In turn, the way you finance your note position can have an effect on the break-even conditions for a term TED spread trade.
Overnight Financing
Consider, first, the problem of financing. If you finance your Treasury position in the overnight RP market, you are exposed to changes in the value of the stub rate. You can hedge this exposure by adding an appropriate number of Eurodollar futures to your position in the lead contract. For our June 5 trade, we would add 16 or 17 contracts to our June ′95 position. Taking this approach introduces some slippage in the P/L of the trade because the June ′95 contract is a cross-hedge for exposure to the stub rate. Also, this approach requires you to adjust your hedge by small amounts each day if you want to avoid any directional exposure in the trade. As shown in Exhibit 11.8, the number of contracts needed to hedge against exposure to the stub rate is only 9 contracts 1 week later. To compensate for this decline, you would have to remove one contract a day from your hedge.
Or you can choose not to hedge your stub exposure at all. If you take this route, then you are combining a small financing trade with the TED spread trade. By not hedging the stub exposure, you are earning a term rate on the Treasury note and paying overnight financing. You are riding the yield curve, and the risks and returns to such a trade are well known.
Term Financing
You can instead choose to finance your Treasury note position in the term RP market to the first Eurodollar futures expiration. If you do, your term financing hedges your exposure to the stubrate, and you can ignore the 16 or 17 contracts that Exhibit 11.8 indicates as the hedge for the stub rate.
Carry and Convergence
However you choose to finance your position, carry affects the break-even conditions for a term TED trade. Consider a long position in the 2-year term TED spread on June 5, 1995. The term RP rate at which one could have financed a Treasury note position to the expiration of the June ′95 Eurodollar futures contract was about 5.95 percent, which was only 5 basis points lower than the Eurodollar stub rate of 6.0009 percent. The 2-year implied Eurodollar term TED spread was trading on June 5 at 15.2 basis points. As a result, the value of the TED spread for the stub period was smaller than the value of the term TED spread for the entire life of the note.
The effect of carry and the passing of time on the value of a term TED spread trade can be determined by reckoning a forward value of the term TED spread. The first step is to find a forward price for the note. If you want to remove the influence of the stub period from the trade, the appropriate forward date will be the value date for the first Eurodollar futures expiration. This forward price, given the RP rate at which you can finance the note, is a break-even price. Given the forward price, you can easily determine the forward yield on the note. The second step is to calculate the implied Eurodollar price of the note as of the forward date. From this you would calculate the forward yield implied by Eurodollar rates. The difference between the two is a forward TED spread and represents the value to which the spot term TED spread must converge if the trade is to break even.
On June 5, for example, the spot value of the 2-year term TED spread was 15.2 basis points. The term RP rate to the first Eurodollar futures expiration was 5.95 percent. Using this RP rate to find the 2-year note’s forward price and converting this forward price to a yield, we find that its forward yield is 5.530 percent. For the same forward date, we find that its implied Eurodollar yield is 5.684 percent. Thus, the note’s forward term TED spread is 15.4 basis points, and this is its break-even value. That is, if you buy the note on June 5, finance it term, and sell an appropriate combination of Eurodollar futures to hedge the note, the position will just break even if the TED spread widens 0.2 basis points, from its initial value of 15.2 basis points to its forward value of 15.4 basis points.
In this instance, the spread has to widen for the trade to break even because the spread between the Eurodollar stub rate and the term RP rate is smaller than the full 2-year term TED spread. If the difference between the stub and term RP rates were larger than the full term TED spread, the break-even term TED spread would be lower than the spot spread.
Convexity
Because a Treasury note exhibits positive convexity, while Eurodollar futures exhibit no convexity, you will find yourself having to adjust your hedges as rates rise and fall. If you are long the term TED spread, this will work in your favor because a decrease in rates will require you to sell additional Eurodollar futures while an increase in rates will require you to buy back some of your short Eurodollar futures. Because you are selling Eurodollar futures when rates fall and buying Eurodollar futures when rates rise, you will find yourself systematically selling high and buying low. Just how much this is worth to you depends on how much convexity the note exhibits and how much rate volatility the market delivers. (Exhibit 11.12 shows how much we estimated the convexity bias to be worth over the entire lives of notes with maturities ranging from 2 to 10 years.)
FORWARD TERM TED SPREADS
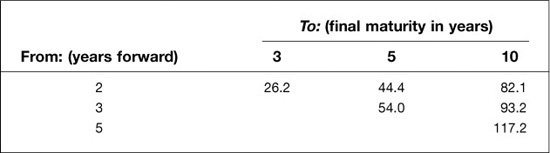
One can also measure and trade forward term TED spreads. Exhibit 11.9 provides various examples of such spreads for standard Treasury maturities. For example, the 2 × 5 term TED spread (that is, the 3-year term TED spread 2 years forward) on June 5 was 44.4 basis points. The value of the 5 × 10 term TED spread (that is, the 5-year term TED 5 years forward) was 117.2 basis points.
EXHIBIT 11.9
Forward Term TED Spreads
Implied Eurodollar/Treasury Spreads for June 5, 1995 (in bps)
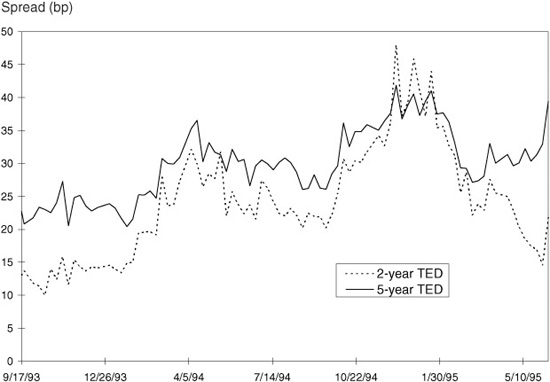
Forward term TED positions may afford interesting trading opportunities. The upper panel of Exhibit 11.10 shows, for example, that over recent weeks, the 2-year term TED spread has been trading somewhat cheap while the 5-year term TED has been trading at the upper end of its range. As a result, the 2 × 5 term TED spread, which is shown in the lower panel of Exhibit 11.10, has become comparatively rich.
EXHIBIT 11.10
2-Year versus 5-Year Term TED Spreads
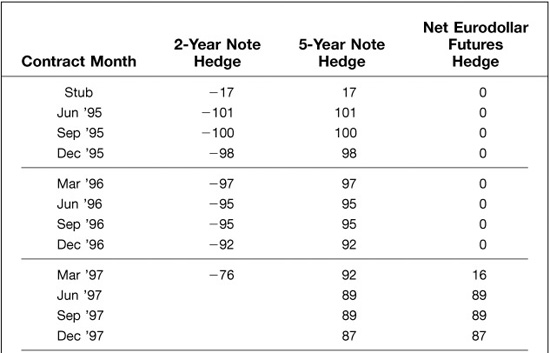
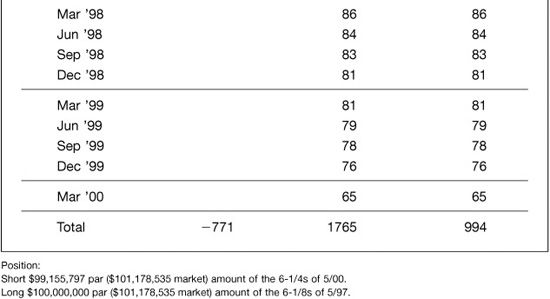
Just how one would sell such a position is illustrated in Exhibit 11.11. There is no active forward market for Treasury notes, but one can construct synthetic forwards in the cash market. On June 5, for example, one could have sold $99.155797 million par amount of the on-the-run 5-year note (the 6-1/4s of 5/00) and bought $100 million par amount of the on-the-run 2-year note (the 6-1/8s of 5/97). Given the full prices of these notes, one would be long and short equal market values of the two notes. The appropriate Eurodollar futures hedge for this position would be a long strip in which the first expiration would be the March ′97 contract. This hedge is simply the net of the Eurodollar hedges for the two note positions, a short 2-year strip for the 2-year note and a long 5-year strip for the 5-year note.
EXHIBIT 11.11
Eurodollar Hedge for a 2 × 5 Term TED Spread June 5, 1995
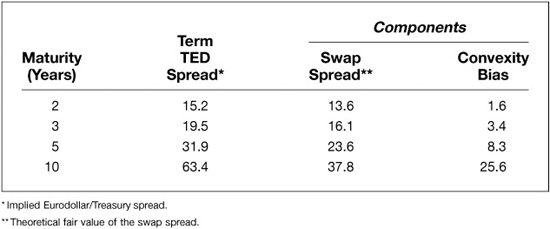
TERM TED SPREADS AND SWAP SPREADS
Term TED spreads are closely related to swap spreads. Swap spreads measure the spread of swap rates over Treasury note yields, while term TED spreads capture the difference between Eurodollar futures rates and Treasury note yields. If swaps were priced right on top of the Eurodollar curve—that is, if swap rates were equal to those implied by Eurodollar futures rates—the two spreads would be the same. As it is, swap rates are slightly lower than those implied by Eurodollar futures rates because of the value of the convexity difference between Eurodollar futures and interest rate swaps.2 Because of this convexity bias, the term TED spread is slightly larger than the swap spread. In particular, if we use the implied Eurodollar/Treasury form of the term TED spread, we can write the term TED spread as
Term TED spread = Swap spread +Value of the convexity bias
Exhibit 11.12 shows how much the convexity bias can influence the difference between term TED spreads and conventional swap spreads. Notice that the influence of the convexity bias increases rapidly with maturity. On June 5, the value of the convexity bias for a 2-year horizon was only 1.6 basis points. For a 5-year horizon, though, the convexity bias was worth 8.3 basis points and for a 10-year horizon was worth 25.6 basis points.
EXHIBIT 11.12
Components of the Term TED Spread June 5, 1995
The term TED spread, then, is a composite trade whose value depends both on the market’s assessment of the swap spread and on the market’s assessment of the value of the convexity bias. As shown in Exhibit 11.13, the parts can add up to more or less than the whole. On June 5, for example, the 5-year swap spread was trading at 27.5 basis points, while our estimate of the value of the convexity was 8.3 basis points. Taken together, these two numbers suggest that the term TED spread should have been trading at 35.8 basis points. As it was, the term TED spread was trading at 31.9 basis points, or 3.9 basis points less than its theoretical value.
EXHIBIT 11.13
Parsing the 5-Year Term TED Spread Basis Points
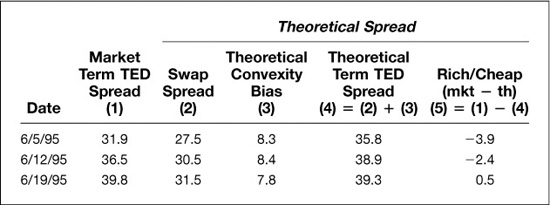
A situation like this affords opportunities for traders. Taken together, for example, the term TED spread market and the swap market think that the value of the convexity bias is only 4.4 [= 31.9 − 27.5] basis points. At the same time, the term TED market, given our estimate of the value of the convexity bias, thinks that swaps should be trading at only 23.6 [= 31.9 − 8.3] basis points. And, of course, the term TED spread appears cheap from the perspective of the swap market for those who are confident that convexity is really worth 8.3 basis points. As it was, these apparent mispricings resolved themselves over the next two weeks, in part because the term TED spread increased relative to swap rates, and in part because the estimated value of the convexity bias fell somewhat.