
CHAPTER 7
The Convexity Bias in Eurodollar Futures
SYNOPSIS
There is a systematic advantage to being short Eurodollar futures relative to deposits, swaps, or FRAs. Because of this advantage, which we characterize as a convexity bias, Eurodollar futures prices should be lower than their so-called fair values. Put differently, the 3-month interest rates implied by Eurodollar futures prices should be higher than the 3-month forward rates to which they are tied.
The bias can be huge. As Exhibit 7.1 shows, the bias is worth little or nothing for futures that have less than 2 years to expiration. For a futures contract with 5 years to expiration, however, the bias is worth about 17 basis points. And for a contract with 10 years to expiration, the bias can easily be worth 60 basis points.
EXHIBIT 7.1
Convexity Bias
June 13, 1994
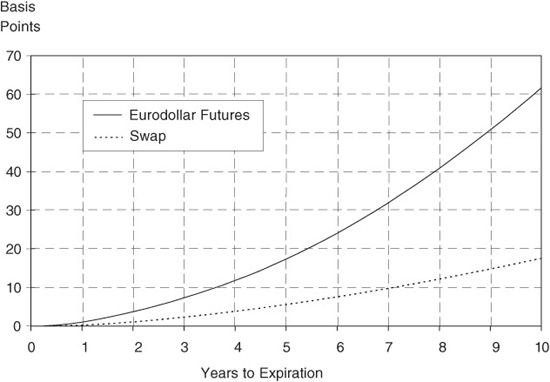
The presence of this bias has profound implications for pricing derivatives off the Eurodollar futures curve. For example, a 5-year swap yield should be about 6 basis points lower than the yield implied by the first 5 years of Eurodollar futures. A 10-year swap yield should be about 18 basis points lower. And the differential for a 5-year swap 5 years forward should be around 36 basis points. (These estimates are explained in Exhibits 7.10, 7.14, and 7.15.)
These are big numbers. A 6-basis-point spread is worth more than $200,000 on a $100 million 5-year swap. An 18-basis-point spread is worth about $1.2 million on a $100 million 10-year swap.
Although the swap market has begun to recognize this problem, swap yields still seem too high relative to those implied by Eurodollar futures rates. (See Exhibit 7.16.) If so, there is still a substantial advantage in favor of receiving fixed/paying floating on a swap and hedging with short Eurodollar futures. Also, because the value of the convexity bias depends so much on the market’s perceptions of Eurodollar rate volatilities, one should be able to trade the value of the swap/Eurodollar rate spread against options on forward Eurodollar rates. The convexity bias also affects the behavior of the yield spreads between Treasury notes and Eurodollar strips.
Students of Eurodollar futures pricing should like this note. The standard approach to estimating the value of the convexity bias (also known as the financing bias) has been bound up in complex yield curve simulations and option pricing calculus. And, although such methods can yield reasonable enough answers, we show how the problem can be solved much more simply. For that matter, anyone armed with a spreadsheet program and an understanding of rate volatilities and their correlations can estimate the value of the convexity bias without recourse to expensive research facilities.
INTRODUCTION
The difference between a futures contract and a forward contract is more pronounced for Eurodollar futures, swaps, and FRAs than for any other commodity. In particular, there is a systematic bias in favor of short Eurodollar futures relative to deposits, swaps, or FRAs. As we show, the value of this bias is particularly large for futures contracts with expirations ranging from 5 to 10 years. The purpose of this note is to show:
• Why the difference is so important for Eurodollar futures
• How to estimate the value of the difference
• What traders can do about the difference
What we find is that the implications for swap traders and those who manage swap books are particularly important. Given the rate volatilities that we have observed over the past 4 years or so, it seems that market swap yields should be several basis points lower than the implied swap yields that one calculates from the rates implied by Eurodollar futures prices. Judging by current spreads between these rates, it appears that the swap market has not fully absorbed the implications of this pricing problem. As a result, there still appear to be profitable opportunities for receiving fixed/paying floating on swaps and hedging with short Eurodollar futures. By the same token, this pricing problem raises serious questions about how a swap book should be marked to market.
INTEREST RATE SWAPS AND EURODOLLAR FUTURES
Interest rate swaps and Eurodollar futures both are driven by the same kinds of forward interest rates. But the two derivatives are fundamentally different in one key respect. With an interest rate swap, cash changes hands only once for each leg of a swap, and then only in arrears. With a Eurodollar futures contract, gains and losses are settled every day. As it happens, the difference in the way gains and losses are settled affects the values of swaps and Eurodollar futures relative to one another. In particular, there is a systematic bias in favor of receiving fixed and paying floating on a swap and against a long Eurodollar futures contract. Or one can think of the short Eurodollar position as having an advantage over paying fixed and receiving floating on a swap. Either way, because swap prices are so closely tied to Eurodollar futures prices, it is important to know how much this bias is worth.
The easiest way to understand the difference between the two derivatives is through a concrete example that compares the profits and losses on a forward swap with the profits and losses on a Eurodollar futures contract.
A Forward Swap
A plain vanilla interest rate swap is simply an arrangement under which one side agrees to pay a fixed rate and receive a variable or floating rate over the life of the swap. The other side agrees to pay floating and receive fixed. The amounts of money that one side pays the other are determined by applying the two interest rates to the swap’s notional principal amount.
The typical swap allows the floating rate to be reset several times over the swap’s life. For example, a 5-year swap keyed to 3-month LIBOR would require the value of the floating rate to be set or reset 20 times—once when the swap is transacted and every 3 months thereafter. One can think of the swap, then, as having 20 separate segments, with the value of each segment depending on the swap’s fixed rate and on the market’s expectation today of what the floating rate will be on that segment’s rate setting date.
The starting point for our example is the structure of Eurodollar futures prices and rates shown in Exhibit 7.2. These were the final settlement or closing prices on Monday, June 13, 1994. Each of the implied futures rates roughly corresponds to a 3-month period. The actual number of days covered by each of the futures contracts is shown in the right-hand column.
EXHIBIT 7.2
Structure of Eurodollar Futures Rates
June 13, 1994
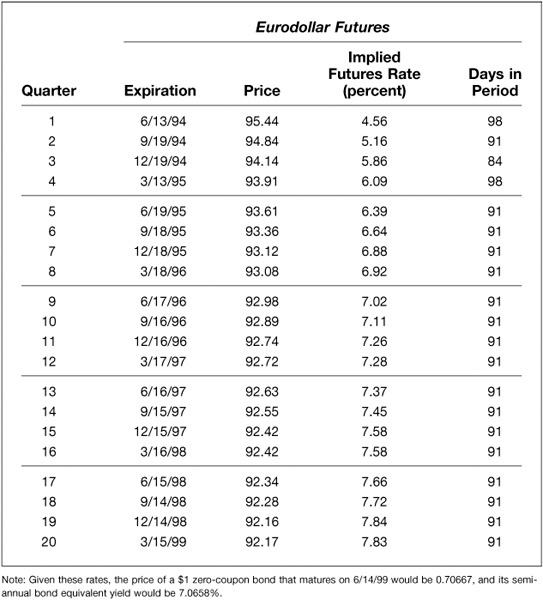
Now consider a swap that settles to the difference between a fixed rate and the value of 3-month LIBOR on March 15, 1999. On June 13, 1994, this would be a forward swap whose rate setting date is 4-3/4 years away and whose cash settlement date is a full 5 years away. To make the example more concrete, suppose that the forward swap’s notional principal amount is $100 million. Suppose too that the fixed rate for this swap is 7.83 percent, which is the forward value of 3-month LIBOR implied by the March 1999 Eurodollar futures contract. This may not be strictly the correct thing to do, but throughout this note we use futures rates in lieu of forward rates because we have much better information about the futures rates. And, although the purpose of this note is to explain why the two rates should be different, we can use the behavior of futures rates as an excellent proxy for the behavior of forward rates.
The Value of a Basis Point
Under the terms of this forward swap, if the value of 3-month LIBOR turns out to be 7.83 percent on March 15, 1999, no cash changes hands at all on June 14. For each basis point that 3-month LIBOR is above 7.83 percent, the person who pays fixed and receives floating on the swap receives $2,527.78 [= 0.0001 × (91/360) × $100,000,000] on June 14, 1999. For each basis point that 3-month LIBOR is below 7.83 percent, the person who pays fixed/receives floating on the swap pays $2,527.78.
Thus, the nominal value of a basis point for this swap is $2,527.78, with the cash changing hands 5 years in the future.
Eurodollar Futures
The futures market has based much of its success on a single operating principle. That is, all gains and losses must be settled up at the end of the day—in cash. This is as true of Eurodollar futures as it is of any futures contract.
Consider the March 1999 Eurodollar futures contract. When it expires on March 15, 1999, its final settlement price will be set equal to 100 less the spot value of 3-month LIBOR on that day. Before expiration, the Eurodollar futures price will be a function of the rate that the market expects. If there were no difference between a futures contract and a forward contract, and if the market expected a forward rate of 7.83 percent, for example, the futures price would be 92.17 [= 100.00 − 7.83]. If the market expected 7.84, the futures price would be 92.16. That is, a 1-basis-point increase in the value of the forward rate produces a 1-tick decrease in the futures price.
Under the Chicago Mercantile Exchange’s rules, each tick or 0.01 in the price of a Eurodollar futures contract is worth $25. This is true whether the futures contract expires 10 weeks from now, 10 months from now, or 10 years from now. The nominal value of a basis point change in the underlying interest rate is always $25.
Reconciling the Difference in Cash Flow Dates
We now have two cash payments that are tied to the same change in interest rates. For the particular forward swap in our example, a 1-basis-point change in the expected value of 3-month LIBOR for the period from March 15 to June 14, 1999, changes the expected value of the swap settlement on June 14 by $2,527.78. At the same time, a 1-basis-point change in the same rate produces a $25 gain or loss that the holder of a Eurodollar futures contract must settle today. The difference in timing is illustrated in Exhibit 7.3.
EXHIBIT 7.3
Cash Consequences of a Change in a Forward Rate

The simplest way to reconcile the timing difference is to cast the two amounts of money in terms of present values. Eurodollar futures are easy to handle. Because gains and losses are settled every day in the futures market, the present value of the $25 basis point value on a Eurodollar futures contract is always $25.
The present value of the $2,527.78 basis point value for the swap can be determined using the set of futures rates provided by a full strip of Eurodollar futures. For example, if we suppose that $1 could be invested on June 13, 1994, at the sequence of rates shown in Exhibit 7.2—for example, 4.56% for the first 98 days, 5.16% for the next 91 days and so on—the total value of the investment would grow to $1.41509 by June 14, 1999. Put differently, the present value in June 1994 of $1 to be received in June 1999 would be $0.70667 [= $1/$1.41509]. This is shown in the explanatory note at the bottom of Exhibit 7.2 as the price of a zero-coupon bond with 5 years to maturity. At this price, the present value of $2,527.78 5 years hence would be $1,786.30 [= $2,527.78 × 0.70667].
Hedging the Forward Swap with Eurodollar Futures
Given these two present values, 71.45 [= $1,786.30/$25.00] Eurodollar futures contracts would have the same exposure to a change in the March 1999 3-month forward rate as would $100 million of the forward swap. For someone who receives fixed and pays floating on the swap, the appropriate hedge against a change in the forward rate would be a short position of 71.45 Eurodollar futures. Considering what has gone into this calculation, the number of Eurodollar futures needed to hedge any leg of a swap whose floating rate is 3-month LIBOR would be
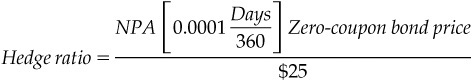
where NPA is the swap’s notional principal amount, or $100 million in our example. The 0.0001 represents a 1-basis-point change in the forward rate. Days is the number of days in the period, which is 91 in our example. The Zero-coupon bond price is the price today of a bond that pays $1 on the same day that the swap settlement is paid. In our example, the swap settlement is 5 years away, and the price of such a bond is 0.70667. The $25 is simply the present value of a basis point for a Eurodollar futures contract.
The Other Source of Interest Rate Risk in the Forward Swap
Because any gain or loss on the swap is realized only at the end of the term, a swap can have unrealized asset value. In particular, the present value of the receive fixed/pay floating forward swap in our example can be written as
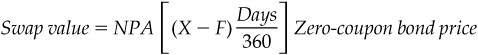
where X is the fixed rate at which the swap was struck originally and F is the current market value of the forward rate. From this we can see that the unrealized asset value of a swap depends both on the difference between the swap’s fixed rate and the forward rate and on the present value of a dollar to be received on the swap’s cash settlement date.
The practical importance of this expression is that there are really two sources of interest rate risk in a forward swap. The first, which we have dealt with already, is uncertainty about the forward rate, F. The other is uncertainty about the zero-coupon bond price, which reflects uncertainty about the entire term structure of forward rates extending from today to the swap’s cash settlement date. If the forward rate is below the fixed rate, for example, the person who is receiving fixed and paying floating has an asset whose value is reduced by a general increase in interest rates. To get complete protection against interest rate risk, the swap hedger must offset not only the exposure to changes in the forward rate, but exposure to changes in the term or zero-coupon bond rate as well. The simplest way to hedge against exposure to changes in zero-coupon term rates is to buy or sell an appropriate quantity of zero-coupon bonds whose maturity matches that of the swap.
Interaction between the Two Sources of Risk
Now we have come to the heart of the difference between a swap and a Eurodollar futures contract. With Eurodollar futures, the only source of risk is the forward or futures rate. When the futures rate changes, the holder of the futures contract collects all of the gains or pays all of the losses right away. The holder of the swap, on the other hand, faces two kinds of risk—a change in the forward rate and a change in the term rate.
To see why this matters, consider what happens to a receive fixed/pay floating swap and a short Eurodollar position if all 20 of the 3-month spot and forward rates from June 1994 through March 1999 either rise or fall by 10 basis points. The results of such an exercise are shown in Exhibit 7.4. Note, first, that the $17,863 gain on the short Eurodollar position when the March 1999 futures rate rises 10 basis points is the same as the $17,863 loss when the futures rate falls 10 basis points.
EXHIBIT 7.4
Swap and Eurodollar Futures P/Ls
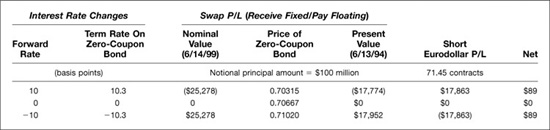
Similarly, the nominal loss on the receive fixed swap—$25,278—when the March 1999 forward rate rises is equal to the nominal gain when the forward rate falls. Notice, however, that the present values of the gain and the loss on the swap are not the same. This is because the price of the zero-coupon bond falls when the forward rates rise and rises when the forward rates fall. Taking the rates in Exhibit 7.2 as our starting point, the price of the zero-coupon bond falls to $0.70315 per dollar when all of the forward rates increase 10 basis points. The price of the zero increases to $0.71020 when all of the forward rates fall 10 basis points. (Because of differences in compounding conventions, the semiannual bond equivalent yield on the zero-coupon bond changes by 10.3 basis points when the various forward rates change 10 basis points.)
With these changes in the price of the zero-coupon bond, the present value of the loss on the swap if all rates rise 10 basis points is $17,774 [= $25,278 × 0.70315], while the present value of the gain on the swap if rates fall 10 basis points is $17,952. As a result, we find that the short Eurodollar position makes $89 more than is lost on the swap if all forward rates rise and loses $89 less than is gained on the swap if interest rates fall.
A familiar way of depicting this comparison is provided in Exhibit 7.5. A receive fixed/pay floating swap, which requires the holder to pay a floating or variable rate such as 3-month LIBOR while receiving a known fixed rate, is much the same as owning a bond that is financed with short-term money. The price/yield relationship for such a position exhibits what is known in the fixed income trade as positive convexity. That is, the price increases more when yields fall than the price falls when yields rise. In our example, the increase in the swap’s price was $17,952 while the decrease in its price was only $17,774. A Eurodollar futures position, on the other hand, exhibits no convexity at all. Each basis point change in the forward rate is worth $25 today no matter what the level of the interest rate. The short Eurodollar position makes $17,863 for a 10-basis-point increase in rates and loses $17,863 for a 10-basis-point decline in rates.
EXHIBIT 7.5
The Convexity Difference between Swaps and Eurodollar Futures
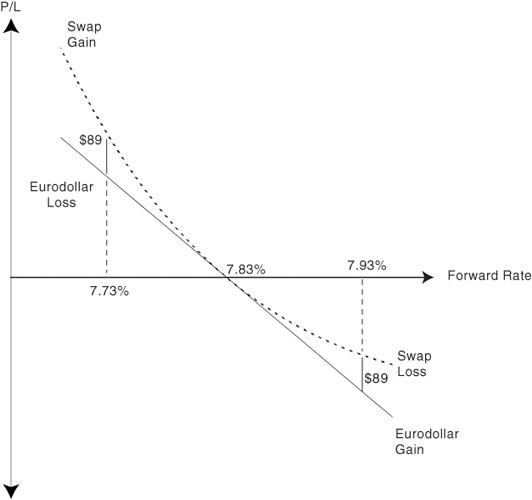
Because of the difference in the convexities of the two instruments, a receive fixed/pay floating swap hedged with a short position in Eurodollar futures benefits from changes in the level of interest rates. As shown in Exhibit 7.5, the difference in convexities for the forward swap in our example is worth $89 if rates rise 10 basis points and $89 if rates fall 10 basis points.
Trading the Hedge
Exhibit 7.5 provides an especially useful way to illustrate the nature of the trade. For example, if interest rates fall 10 basis points, the hedger of the receive fixed swap is $89 ahead of the game. At this point, the hedger could (in principle, if not for the costs imposed by bid/asked spreads and brokerage) close out the position and pocket the $89. On the other hand, the hedger could view this as a vehicle for trading Eurodollar futures that would eventually accumulate a substantial amount of money. Notice that as rates fall, the number of futures needed to hedge the position increases, which requires selling the additional contracts at a higher price. On the other hand, as rates rise, the number of futures needed to hedge the position falls, which requires the hedger to cover some of the short futures by buying the excess contracts at a lower price.
HOW MUCH IS THE CONVEXITY BIAS WORTH?
The difference in the performance of a swap and the performance of a Eurodollar futures contract depends on three things:
• The size of the change in the forward rate
• The size of the change in the term rate (or zero-coupon bond price)
• The correlation between the two
These points are illustrated in Exhibit 7.6, which shows the net hedge P/L on our $100 million forward swap for a variety of different possible rate changes.
EXHIBIT 7.6
Net P/Ls for a Receive Fixed/Pay Floating Swap Hedged with Short Eurodollar Futures
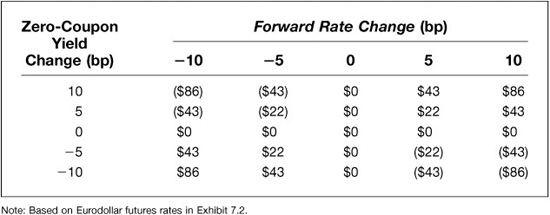
If both rates rise 5 basis points, the net P/L is $22. If both rates rise 10 basis points, the net gain is $86, or nearly four times as much. (The net gain in this instance is less than the $89 produced by the example illustrated in Exhibit 7.4 because the term rate in this instance has only changed by 10 basis points rather than the 10.3 basis points produced by a parallel shift in all 3-month spot and forward rates.) Also, if the forward rate rises 10 basis points while the zero-coupon rate rises only 5 basis points, the net P/L is $43. From this we can conclude that the value of the convexity difference is greater when interest rates are volatile than when they are stable.
Exhibit 7.6 also allows us to see the importance of correlation. The net P/Ls are positive if the two interest rates both rise or both fall. If one rate falls while the other rises, the hedged position actually loses money. If one rate changes while the other does not, there is neither a gain nor a loss.
Moreover, if the zero-coupon yield is just as likely to rise as it is to fall no matter what happens to the forward rate, the expected or average net P/L is also zero. For example, if the forward rate increases 10 basis points, the net P/L is a gain of $86 if the zero-coupon rate also increases 10 basis points. The net P/L is a loss of $86, though, if the zero-coupon rate falls 10 basis points. If the probability of the zero-coupon rate rising is a half no matter what happens to the forward rate, then the expected or probability weighted average gain would be zero.
How Correlated Are the Rates?
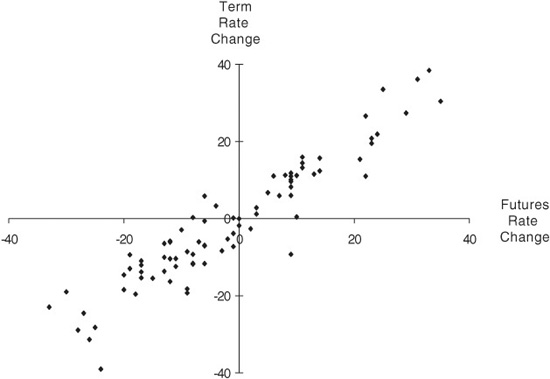
As it happens, forward interest rates and their respective term or zero-coupon rates tend to be very highly correlated. Eurodollar futures rates and strips can be used to estimate the correlation. Exhibit 7.7 shows, for example, the relationship between changes in 3-month rates 4-3/4 years forward and changes in 5-year zero-coupon term rates. As you can see, the correlation is not perfect, but with only a few exceptions, increases in the forward rate are accompanied by increases in the term rate, and decreases in the forward rate are accompanied by decreases in the zero-coupon term rate.
EXHIBIT 7.7
Changes in 5-Year Term Rates versus Changes in the 4-3/4 Year Futures Rate
In Basis Points
(Weekly Interval, 7/10/92 through 7/1/94)
Estimating the Value of the Convexity Bias
To get a rough idea of how much the convexity bias might be worth, we used actual Eurodollar futures data to calculate hedge 1-week P/Ls for 3-month forward swaps with 2 years and 5 years to final cash settlement. The calculations were much like those summarized in Exhibit 7.4. In particular, we used 1-week changes in the price of the eighth contract in an 8-contract strip to represent the change in a 3-month forward rate 1-3/4 years forward. We used all eight rates implied by the 8-contract strip to calculate 2-year zero-coupon bond prices and then calculated the 1-week price changes associated with 1-week changes in the 2-year term rate. For the longer-dated forward swap, we used the change in the price of the 20th contract in a 20-contract strip to represent the change in a 3-month forward rate 4-3/4 years forward and all 20 rates in the strip to calculate the price of a 5-year zero-coupon bond.
The results of these exercises for the 3-month swap 1-3/4 years forward are shown in Exhibit 7.8. The results for the 3-month swap 4-3/4 years forward are shown in Exhibit 7.9. In both cases, the hedge P/L has been divided by the number of futures contracts in the hedge so that the results are expressed in dollars per Eurodollar futures contract. In other words, Exhibit 7.8 shows the distribution of hedge P/Ls per futures for contracts that would have had 1-3/4 years to expiration, while Exhibit 7.9 shows the distribution of hedge P/Ls per futures for contracts that would have had 4-3/4 years to expiration.
EXHIBIT 7.8
Hedge P/L for a 3-Month Swap 1-3/4 Years Forward
(Weekly Gains Per Futures Contract, 1/5/90 through 7/1/94)
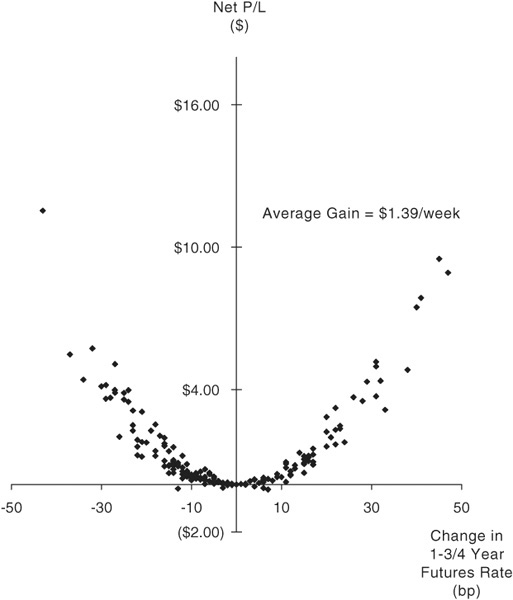
EXHIBIT 7.9
Hedge P/L for a 3-Month Swap 4-3/4 Years Forward
(Weekly Gains per Futures Contract, 7/10/92 through 7/1/94)
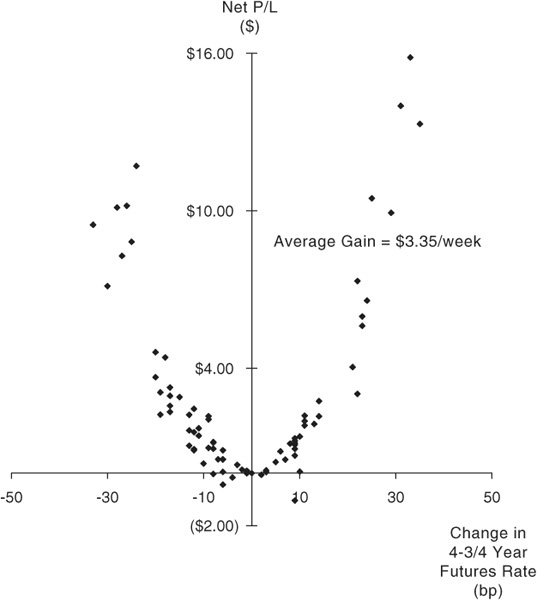
Three things stand out. First, both relationships look a lot like long straddles or strangles in Eurodollar options. In fact, while the resemblance is close, the net P/L relationships in Exhibits 7.8 and 7.9 are much more like parabolas than are straddle and strangle P/Ls. Even so, the option-like quality of a swap hedged with Eurodollar futures is pronounced.
Second, the convexity is more pronounced for the 3-month swap 4-3/4 years forward than for the 3-month swap 1-3/4 years forward. This is natural enough. Longer-dated swaps exhibit greater convexity than do shorter-dated swaps, and that is what we are seeing in these two exhibits.
Third, the distribution of outcomes looks about right. As one would expect, most of the realized outcomes involved fairly small changes in the forward rate and correspondingly small net P/Ls on the hedged position. Only some of the changes were very large.
Calculating the Value of the Bias
Given the outcomes plotted in Exhibits 7.8 and 7.9, it is now a simple matter to calculate the average net P/L. Exhibit 7.8 shows that the average outcome amounted to $1.39 per Eurodollar contract per week for futures with 1-3/4 years to expiration. Exhibit 7.9 shows that the average hedge P/L was $3.35 per Eurodollar contract per week for futures with 4-3/4 years to expiration.
RECONCILING THE DIFFERENCE BETWEEN A SWAP AND A EURODOLLAR FUTURES CONTRACT
If you have been thinking ahead, you may see in all of this the makings of a free lunch. Exhibits 7.8 and 7.9 show all upside and no downside. As it happens, if Eurodollar futures prices were simply 100 less the appropriate forward rates, one could make money easily enough simply by receiving fixed/paying floating on swaps and hedging them with short Eurodollar futures. Unhappily for the swaps community, Milton Friedman was right in reminding us that there is no such thing as a free lunch—at least not for long.
If there is an advantage to being short Eurodollar futures, then one should be willing to pay for the advantage. The interesting questions then are how much this lunch should cost and how one should pay.
How One Would Pay for the Advantage
How one pays for the advantage is comparatively easy to describe. To make the P/L distribution shown in Exhibit 7.8 a fair bet, the whole distribution would have to be shifted down $1.39 for the week. To make the distribution in Exhibit 7.9 a fair bet, the whole distribution would have to be shifted down $3.35.
The easiest way to do this is to allow the futures rate to drift down relative to the forward rate. This would cause the futures price to drift up relative to the value of the swap. At the right rate of drift, the hedger who pays floating on the swap and is short futures would expect to give up $1.39 per week or $3.35 per week due to drift but would make it back on average because of the convexity differences. In other words, the futures rate implied by any Eurodollar futures price must start out higher than its corresponding forward rate and drift down to meet it at futures contract expiration. And, for what we are doing, it makes no particular difference how one rate converges to the other. The futures rate can fall to meet the forward rate, the forward rate can rise to meet the futures rates, or the two rates can converge to one another. They are all the same to us.
If the presence of a convexity bias means that the futures rate should be higher than the forward rate, then we have to be careful about how we calculate the so-called fair value of a futures contract. The market convention is to define the fair value of the futures as 100 less the value of the forward rate. Considering the value of the bias in favor of short Eurodollar futures, the fair value of the futures contract should be lower than is provided by the conventional definition. How much lower depends on the value of the convexity bias.
Translating the Advantage into Basis Points
In Exhibit 7.8 we found that the average net hedge gain for the 3-month swap 1-3/4 years forward was $1.39 per week per futures contract. At $25 per basis point for a Eurodollar contract, this means that the rate of drift for a Eurodollar futures contract with 1-3/4 years to expiration would have to be about 0.056 [= 1.39/25] basis points per week to compensate for the convexity bias. Over the span of a quarter, the drift would have to be about 0.73 basis points.
In Exhibit 7.9, we found that the average net hedge gain for the 3-month swap 4-3/4 years forward was $3.35 per week per futures contract. Using the same arithmetic, the rate of drift for the Eurodollar contract with 4-3/4 years remaining to expiration would have to be 0.13 basis points per week, or about 1.74 basis points per quarter.
To determine how much the difference should be between a 3-month rate 4-3/4 years forward and the 3-month interest rate implied by a Eurodollar futures contract with 4-3/4 years to expiration, the problem boils down to one of tracking a contract step by step and adding up the drift as the contract approaches expiration.
A WORKABLE RULE OF THUMB
There are a number of ways to determine the value of the convexity bias. One is the empirical approach illustrated in Exhibits 7.8 and 7.9. This is a perfectly good approach if one simply wants to look back and reconcile the historical differences between swaps and Eurodollar futures. The problem with this approach, however, is that it hides the assumptions that go into reckoning the value of the bias and makes it hard to adjust your estimates of the bias as your views about rate volatilities and correlations change.
Another approach is to undertake extensive and complex yield curve simulations that would allow you to estimate the cumulative gains associated with trading a hedged swap book or with financing the mark-to-market gains or losses on a futures contract. Such interest rate simulations can produce reasonable results, but the equipment seems much too heavy for the job and may well obscure what is really going on.
The good news in this note is that the problem can be tackled with relatively light tools. The thrust of what we have done so far is that the value of the convexity bias really depends on only three things—the volatility of the forward rate, the volatility of the corresponding term rate, and the correlation between the two. As it happens, the value of the drift in the spread between the futures and forward rates that is needed to compensate for the advantage of being short Eurodollar futures can be expressed as:
Drift = Standard deviation of forward rate changes
× Standard deviation of zero-coupon bond returns
× Correlation of forward rate changes with
zero-coupon bond returns
where Drift is the number of ticks that the rate spread has to fall during any given period to compensate for the convexity bias. Those who want to know where this expression comes from will find an explanation along with tips on how to apply the rule in Appendix A.
Applying the Rule of Thumb
Exhibit 7.10 provides examples of how to apply this rule to Eurodollar futures contracts with times to expiration ranging from 3 months to 10 years. Consider, for example, the lead futures contract, which has 3 months remaining to expiration. The annualized standard deviation of changes in the lead futures price (or rate) is shown as 0.92% or 92 basis points. (Notice that this is an absolute and not a relative rate volatility like those quoted for Eurodollar options.) The annualized standard deviation of returns on a zero-coupon bond with an average of 4-1/2 months to maturity (the zero begins the quarter with 6 months to maturity and ends the quarter with 3 months remaining) is shown as 0.35% or 35 basis points. This standard deviation is itself the product of the standard deviation of changes in the yield on the zero-coupon bond and the zero’s time to maturity, which is also its duration. The historical correlation between these two changes is shown as 0.9945, which is about as highly correlated as anything can be. Taken together, we find that the required drift over a quarter of a year would be calculated as
EXHIBIT 7.10
Calculating the Value of the Convexity Bias
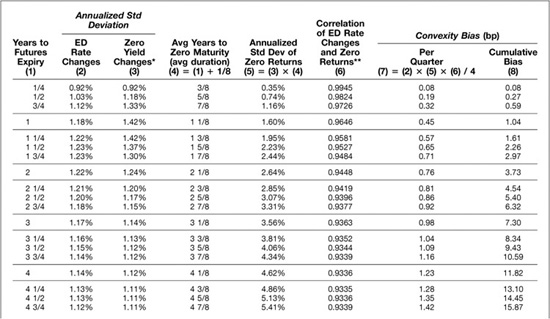
In other words, for a Eurodollar futures contract with 3 months left to expiration, the rate of drift expressed in basis points per quarter would be 0.08 basis points. That is, the spread between the futures and forward rates would have to converge at this rate to compensate for the value of the convexity differential.
The Importance of Time to Contract Expiration
If we do the same exercise for a futures contract that has 6 months left to expiration, we find that the required quarterly rate of drift in the price or the rate is 0.19 basis points [= 1.03% × 0.74% × 0.9824/4], which is over twice as fast. The higher rate of drift is the combined effect of slightly higher rate volatilities, a very slightly lower correlation, and a very much higher duration of the zero-coupon bond.
As we saw in Exhibits 7.8 and 7.9, the value of the convexity bias depends directly on the convexity of the forward swap that is associated with the futures contract. This depends in turn on the price sensitivity of the zero-coupon bond that corresponds to the swap’s maturity. Because the price of a zero-coupon bond with 5 years to maturity is more sensitive to a change in its yield than is the price of a zero with 2 years to maturity, the value of the bias is greater for a Eurodollar futures contract with 4-3/4 years to expiration than for a contract with 1-3/4 years to expiration.
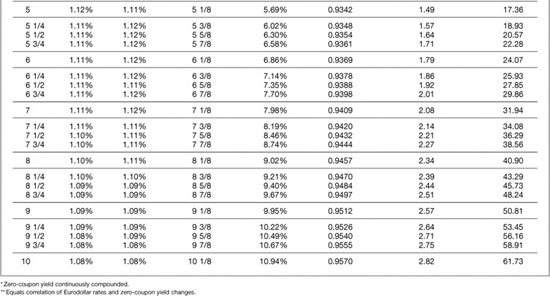
The rule of thumb captures this effect nicely because the standard deviation of a zero-coupon bond’s return is simply the product of the standard deviation of the zero’s yield and its duration. If its yield is reckoned on a continuously compounded basis, then a zero-coupon bond’s duration is simply its maturity. The result is a higher rate of drift for contracts with longer times remaining to expiration. For example, the rate of drift for a contract with 5 years to expiration is shown in Exhibit 7.10 to be about 1.5 basis points per quarter. For a contract with 10 years to expiration, the rate of drift is nearly 3 basis points per quarter.
The Cumulative Effect of All This Drift
We know that when the futures contract expires, its final settlement price will be set equal to 100 less the spot value of 3-month LIBOR. As a result, the implied futures rate and the spot rate have to be the same at contract expiration. We also know that the implied futures rate before expiration should be drifting down relative to the corresponding forward rate so that the two meet on contract expiration day.
The question, then, is how much different the futures and forward rates should be at any time before expiration. The answer to this question is found simply by adding up the quarterly drift estimates, which is what we have done in the last column of Exhibit 7.10. For example, if a futures contract with 3 months to expiration is drifting at a rate of 0.08 basis points per quarter, then the futures and forward rates will have to be 0.08 basis points apart if they are to meet exactly at expiration. On the other hand, if a futures contract with 6 months to expiration is drifting at a rate of 0.19 basis points per quarter for the first 3 months of its life and then at a rate of 0.08 basis points for the last 3 months of its life, the total drift in the contract’s price will be 0.27 [= 0.08 + 0.19] basis points for the entire 6 months. The bias for the next contract out would be 0.59 [= 0.08 + 0.19 + 0.32] basis points, and so on down the list.
For short-dated futures contracts, all of this work adds up to comparatively little. For a contract with 1 year to expiration, for example, the total cumulative value of the bias adds up to only 1.04 basis points. Considering everything else that the market has to worry about, this is really nothing.
On the other hand, the adding up of these little bits of drift per quarter has a profound effect on the spread between futures and forward rates for contracts with several years to expiration. For example, the cumulative value of the bias for a contract with 5 years to expiration is about 17 basis points. For a contract with 10 years to expiration, the cumulative value of the bias is more than 60 basis points.
How Sensitive Are the Estimates to the Assumptions?
The rule of thumb makes it clear that the value of the bias is directly related to three things—the volatility of the forward rate, the volatility of the zero-coupon bond or term rate, and the correlation between the two. In particular, because the rate of drift is calculated simply by multiplying these numbers together, the required rate of drift is directly proportional to the value of each of these three things. If forward rate volatility doubles, the value of the bias doubles too. If term rate volatility doubles, the value of the bias doubles as well. If both double, the value of the bias quadruples. If both rate volatilities were increased by 10 percent, the value of the bias would be increased by 21 percent. In other words, the value that anyone places on the convexity bias depends clearly on his or her views about interest rate volatility.
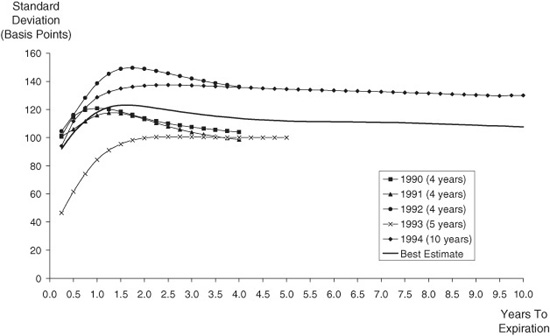
To get an idea of how changeable these three key variables could be, we used Eurodollar futures data to estimate them for different time periods. The results of these exercises are shown in Exhibits 7.11, 7.12, and 7.13. The peculiar look of these exhibits—that is, the reason the lines have different lengths—is because the Chicago Mercantile Exchange has added futures contracts with longer times to expiration in more or less discrete chunks. For example, from 1990 to 1992, futures contracts extended out to 4 years, and so our estimates of rate volatilities and correlations for these years are limited to horizons of 4 years. By the middle of 1992, however, the CME had listed the “golds,” which had 5 years to expiration. Then, by the end of 1993, the exchange had listed contracts with expirations extending out a full 10 years.
EXHIBIT 7.12
Standard Deviation of Term Yield Changes (Annualized)
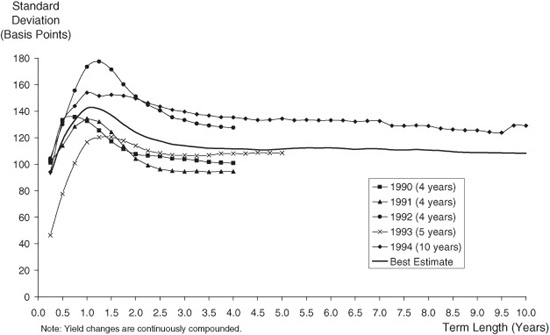
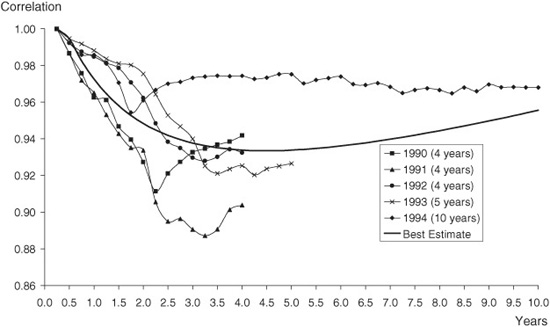
EXHIBIT 7.13
Correlation of Eurodollar Rates and Term Rates
(b) Convexity Adjusted Swap Yields
Even with the mixed collection of data that were available to us, the results are instructive. Consider first the volatility of forward rates, which is represented by the standard deviation of Eurodollar futures rates in Exhibit 7.11. The annualized standard deviation of a 3-month rate 4 years forward in 1993 was around 100 basis points, or 1 percentage point. So far in 1994, the annualized standard deviation of a 4-year forward rate has been closer to 140 basis points. In Exhibit 7.10, we used 114 basis points or 1.14 percent to reckon the value of the convexity bias for a futures contract with 4 years to expiration. (See Exhibit 7.10, column 2.) The estimate of 114 basis points was taken from the solid, unmarked line in Exhibit 7.11 that extends all the way out to 10 years. This line represents our best guess about the structure of forward rate volatilities for the years 1990 through August 1994.
EXHIBIT 7.11
Standard Deviation of Eurodollar Futures Rate Changes (Annualized)
Because the value of the convexity bias is directly proportional to the standard deviation of forward rates and the standard deviation of term rates, the ranges of these standard deviations shown in Exhibits 7.11 and 7.12 impart substantial range to the possible value of the bias. For example, based on our best estimate of rate volatilities over the past 5 years, we reckoned that the value of the bias was 17 basis points for a contract with 5 years to expiration. Because the rule of thumb is linear in rate volatility, we can easily estimate the bias for higher or lower levels of rate standard deviations. For example, if we scale both forward and term rate standard deviations up by 15% (a reasonably high estimate given the volatility experience we saw in Exhibits 7.11 and 7.12), the bias will increase to about 22 basis points [= 17 × (1.15) × (1.15)]. On the other hand, if we scale both standard deviations down by 15% (to a low estimate), the value of the bias will decrease to about 12 basis points [= 17 × (0.85) × (0.85)]. So the true value of the bias for a contract with 5 years to expiration could easily vary between 12 and 22 basis points depending on the market’s assessment of rate volatility.
Of the three key variables, the correlation between changes in forward and zero-coupon bond rates seems to be the most stable. To get a feel for these relationships, we calculated the correlations between changes in Eurodollar strip rates and changes in the rate implied by the last contract in the strip. As shown in Exhibit 7.13, the lowest of these correlations appear to have been in the low 90s or upper 80s, while the highest have been in the upper 90s. We used correlations in the mid-90s to construct the estimates in Exhibit 7.10. Given the range of correlations shown in Exhibit 7.13, changes in correlation from one year to the next would increase or decrease the value of the convexity bias by 3 or 4 percent, which is less than a basis point for a contract with 4 years to expiration and only 2 or 3 basis points for a contract with 10 years to expiration.
Practical Considerations in Applying the Rule
One of the good things about the way we approach the problem of valuing the convexity bias is that anyone with a spreadsheet program and an understanding of rate volatilities and correlations can do the job. To do the job right, however, requires some attention to detail. For those who want to try their hand at it, follow the guidelines provided in Appendix A.
THE IMPORTANCE OF THE BIAS FOR PRICING TERM SWAPS
The swap industry is accustomed to pricing swaps against Eurodollar futures, chiefly because Eurodollar futures prices are thought to provide the most accurate and competitive market information about forward rates. The reasoning behind such a practice is solid because the futures market is more heavily scrutinized by interest rate traders than either the cash deposit market or the over-the-counter derivatives markets.
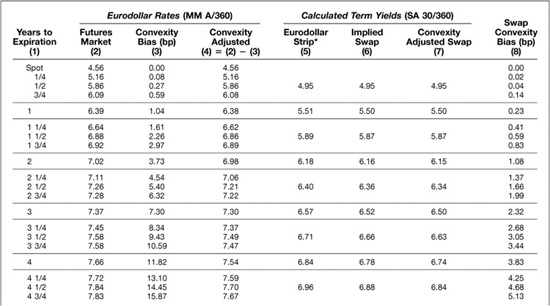
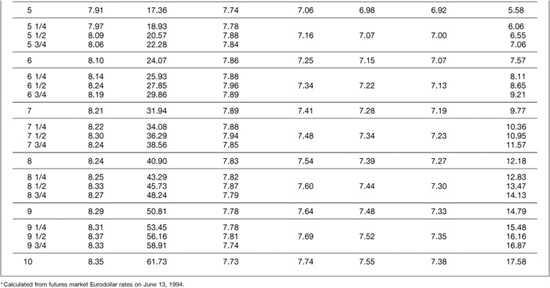
The problem now, however, is that swap traders are gaining a heightened appreciation for the importance of the convexity difference between swaps and Eurodollar futures. Several years ago, when futures expirations only extended out 3 or 4 years, this was not much of a problem. Today, with futures expirations extending to 10 years and with longer-dated swaps trading more actively, the problem of reconciling the differences has become more acute. The effect of the convexity bias on the pricing of swaps against Eurodollar futures is illustrated for term swaps with various maturities in Exhibit 7.14.
EXHIBIT 7.14
(a) Eurodollar and Swap Convexity Bias June 13, 1994

The interest rates shown in the second column of the table represent the spot and implied Eurodollar futures rates on June 13, 1994. If we take these rates at face value and ignore the value of the convexity differences, we can calculate two kinds of term rates. One is the Eurodollar strip rate, which is the same as the rate for a zero-coupon bond with a maturity equal to the length of the strip. Another is an implied swap yield. Examples of both are shown in columns 5 and 6.
For example, the zero-coupon rate for a 5-year Eurodollar strip is shown as 7.06 percent. The swap rate next to it is 6.98 percent. The reason for the difference, which is described in Appendix B, is that a 5-year Eurodollar strip gives equal weight to all 20 of the 3-month rates that go into its calculation. An implied 5-year swap rate, however, gives greater weight to the nearby forward rates than it does to the more distant rates. As a result, if the forward rate curve slopes upward, the implied swap rate is lower than the strip rate.
There is no need to take the futures rates at face value, however. If we are confident in our estimates of the value of the convexity bias, then we can adjust each of the futures rates before calculating the swap rates. No adjustment would be required for the spot rate. An adjustment of 0.08 basis points for the first of the Eurodollar futures rates is too small to have a noticeable effect. The adjustment to the rate implied by the futures contract with 5 years to expiration, however, is 17 basis points. As shown in columns 3 and 4 of Exhibit 7.14, the convexity-adjusted futures rate would be 7.74 [= 7.91 − 0.17] percent. Similarly, the convexity-adjusted futures rate for the longest dated futures contract, which had 10 years to expiration, would be 7.73 [= 8.35 − 0.62] percent to reflect an adjustment of 62 basis points.
These convexity-adjusted futures rates are a much better reflection of the forward rates implied by Eurodollar futures prices and are the rates that we use to calculate what we call convexity-adjusted implied swap rates. For example, the 5-year swap rate implied by the adjusted futures rates would be 6.92 percent, which is 6 basis points less than the 6.98 percent that one would get using the raw unadjusted rates. The 10-year swap rate would be 7.38 percent, which is 17 basis points less than the 7.55 percent obtained from the unadjusted futures rates.
In other words, if our estimates of the convexity biases are reliable, then a 5-year swap rate should be about 6 basis points lower than the rate implied by raw Eurodollar futures rates. A 10-year swap rate should be about 17 basis points lower. Put differently, if one wants to know whether swap yields are rich or cheap relative to Eurodollar futures, the convexity-adjusted yield spreads are the standards against which the market spreads should be compared.
Biases in Forward Swap Rates
The market for forward swaps seems to have been growing recently. For example, one can find more or less active markets for 5-year swaps 5 years forward, or for 2-year swaps 8 years forward. For such swaps, the convexity bias can loom fairly large.
Exhibit 7.15 shows what the bias would be for a wide range of spot and forward swaps given the volatility and correlation assumptions that we have used. Along the top row, for example, are the calculations for spot swaps with terms ranging from 1 to 10 years. The numbers in this row are the same as those in the right-hand column of Exhibit 7.14. Along the second row are the biases for swaps that begin 1 year in the future. For example, the value of the convexity adjustment for a 5-year swap that begins 1 year in the future is about 9 basis points. In contrast, the value of the convexity bias for a 5-year swap that begins 5 years in the future is about 36 basis points.
EXHIBIT 7.15
Convexity Bias in Forward Swaps (bp)

THE MARKET’S EXPERIENCE WITH THE CONVEXITY BIAS
Exhibit 7.16 provides an interesting look at how the market’s appreciation for convexity bias has grown over the past couple of years. We used data on 5-year swap rates to calculate the spread between market swap rates and the swap rates that can be calculated using Eurodollar futures rates. The solid line represents the spread between market swap rates and the swap rates implied by convexity-adjusted futures rates. The dashed line represents the spread between market swap rates and the swap rates implied by the raw unadjusted futures rates. Notice that in 1992, the spread between the market and raw implied swap rates was around zero. In other words, in 1992, swaps appear to have been priced right on top of the Eurodollar futures rate curve. At the same time, the spread between market swap rates and the convexity-adjusted implied swap rates was around 6 basis points.
EXHIBIT 7.16
Spreads between Market and Implied Swap Yields
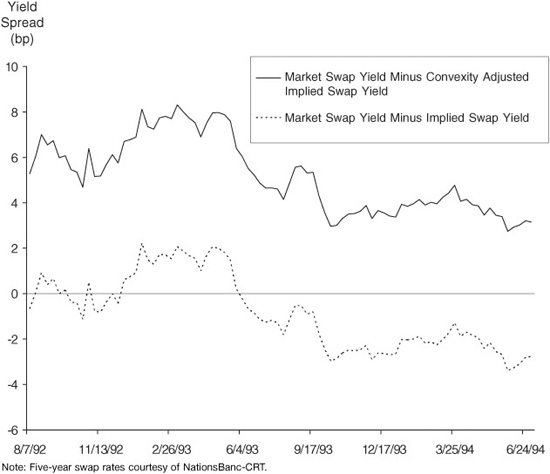
Since then, these spreads have fallen. Market swap rates now tend to trade below those that are implied by raw, unadjusted Eurodollar futures rates. At the same time, the spread between market and convexity-adjusted rates has been drifting down toward zero. In both cases, the drop in the spread suggests that the swap market is adapting to the value of the bias in short Eurodollar futures relative to receive fixed/pay floating swaps. But the adaptation appears to be incomplete. Given our estimates of the value of the convexity bias, there still seems to be some advantage in hedging a receive fixed swap book with short Eurodollar futures.
NOW WHAT?
The natural question to ask now is what can be done with this information. Several possibilities come to mind.
Running a Receive Fixed, Pay Floating Swap Book
Given the size of the swap market, the value of knowing how to price swaps correctly against Eurodollar futures prices is enormous. If a 5-year swap is mispriced by as little as 2 or 3 basis points against Eurodollar futures, the mispricing is worth about $80,000 on a $100 million swap. If a 10-year swap is mispriced by as little as 5 basis points, and our conversations with swap traders suggest that this is possible, the mispricing is worth about $350,000 on a $100 million swap. These are large amounts of money and suggest that there is a lot at stake. For one thing, it suggests that a swap desk can still make money by receiving fixed on swaps and hedging them with short Eurodollar futures.
Marking a Swap Book to Market
Not that bank comptrollers and risk managers need any more to worry about, but the value of the convexity bias between swaps and Eurodollar futures raises a big question about how a derivatives book should be marked to market. The standard for many banks is to mark its swaps to market using Eurodollar futures rates. This standard makes good sense because Eurodollar futures prices are the result of a much more open and competitive market process than are swap yields in the over-the-counter market. The problem we find now, however, is that Eurodollar futures prices produce forward rates that are higher than the forward rates that should be used to value swaps.
This leaves comptrollers and risk managers with a difficult choice. One approach is to stick with raw, unadjusted futures rates. The advantage to this approach is that the rates are easy to calculate and to document and no one can tinker with them. The disadvantage to this approach, though, is that the true value of the swap book is misstated.
The other approach is to make what seems like a reasonable allowance for the value of the convexity bias. This has the advantage of providing better estimates of the value of the swap book and of providing correct incentives for a swap desk. The disadvantage is that convexity-adjusted Eurodollar futures rates depend so much on assumptions about rate volatilities.
Volatility Arbitrage
Because the spread between swap and Eurodollar rates should depend on expected interest rate volatilities every bit as much as the prices of caps and swaptions, one should be able to detect differences in implied rate volatilities and to construct trades that profit from differences between the two markets. For example, the spread between a 5-year swap yield and the swap yield implied by a 5-year strip of Eurodollar futures can be used to impute an expectation about interest rate volatilities from the perspective of swap and Eurodollar traders. The price of a 5-year interest rate cap, on the other hand, reflects that market’s expectations about interest rate volatilities over the same period. A sharp trading desk should be able to arbitrage differences between the two markets’ implied rate volatilities.
Evaluating Term TED Spreads
A trade that has gained considerable popularity over the past few years has been to spread Treasury notes against strips of Eurodollar futures. In practice, the market has viewed this trade as a way of trading the yield spread between private bank paper and Treasury paper. Now we find that the rates implied by Eurodollar futures prices reflect a convexity bias, which means that these trades have a volatility component as well. For notes with 5 to 10 years to expiration, the value of the convexity bias can loom fairly large. The imputed credit spread between the yield on a 5-year Eurodollar strip and a 5-year Treasury note really should be about 6 basis points narrower than it appears to be. In light of the comparatively tight spreads at which Eurodollars have been trading against Treasury notes anyway, such an adjustment would make the imputed credit spread appear to be paper-thin rather than merely narrow.