CHAPTER 14
Hedging Extension and Compression Risk in Callable Agency Notes
SYNOPSIS
The federal financing agencies have raised well over $150 billion by issuing callable notes, and some of these issues have been large. In January, for example, the Federal National Mortgage Agency (FNMA) issued a $1 billion global bond that was offered to the world at large.
The street’s experience with hedging these issues has been hugely disappointing. Because of the embedded call options, these issues behave like short-term notes when yields are low and falling. But when yields are high and rising, the calls drop out of the money and the notes begin to behave like long-term notes. The result is a compression of capital gains when rates fall and an acceleration of capital losses when rates rise. The risk in this kind of note is known variously as compression risk (when yields are already high) and extension risk (when yields are already low). In either case, the consequences of rate changes can be ugly. Also, underwriters and market makers complain that the spreads between the yields on callable agency notes and the yields on Treasury notes are far too variable to allow effective hedging.
Much of this disappointment almost certainly stems from the practice of treating a 10-year note that can be called anytime after 5 years as if its maturity and duration are simply somewhere between those of a 10-year note and those of a 5-year note. The mistake is in treating the call provision as if it does nothing more than shorten the maturity and lower the effective duration of the note. This approach may work well enough when the yield curve rises or falls in parallel, but it does nothing to capture the yield curve exposure that is contained in a callable note.
An effective hedge can be constructed only by taking apart the risk exposure and dealing with the different sources of risk separately. This note shows how to isolate the forward yield risk exposure in the embedded call options from the spot yield risk exposure in the bullet part of the issue. In the process, we show how to capture yield curve risk as well as yield level risk. Examples of what these hedges look like are shown in Exhibit 14.9 (using Treasury futures) and in Exhibits 14.14 and 14.15 (using Eurodollar futures).
We also find that much of the apparent volatility of yield spreads over Treasurys can be explained by changes in the slope and shape of the yield curve. Exhibit 14.1, which shows the spread for a 10-year note callable in 5, illustrates this quite vividly.
EXHIBIT 14.1
Callable Agency Yield Spread over 10-Year Treasury Yield Spread in Basis Points
INTRODUCTION
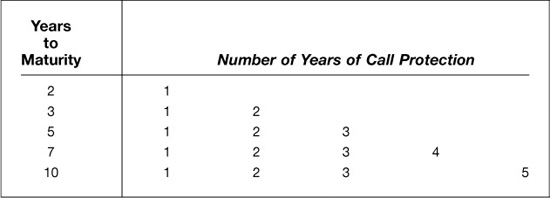
Although some callable agency notes have no call protection, a typical note will specify a period during which it cannot be called. The note illustrated in Exhibit 14.2, for example, has an original maturity of 10 years. During the first 5 of these years, the agency cannot call the note. Once the 5-year mark has been passed, the agency has the right to redeem or call the note at par throughout the remaining life of the note. Notes issued by the Federal Home Loan Banks typically are callable on coupon dates with 10 days notice. Notes issued by the Federal National Mortgage Agency (FNMA) typically are callable any time during the call period with 30 days notice. Typical maturities and no-call periods for these agency issues are shown in Exhibit 14.3.
EXHIBIT 14.2
Structure of a Callable Agency Security 10-Year Note That Cannot Be Called During the First 5 Years of Its Life
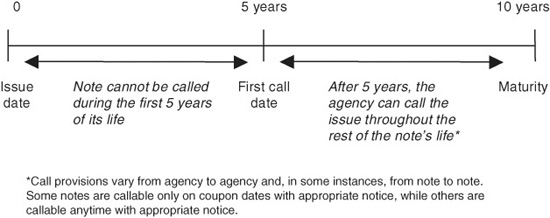
EXHIBIT 14.3
Standard Maturities and Call Features
The key to hedging notes like these effectively is to think of a callable note as a package that combines a noncallable bullet note with one or more call options. This approach allows the hedger to separate the term yield risk in the bullet from the forward yield risk in the forward notes that underlie the embedded call options. Once this is done, it is easy to construct durable hedges using either cash instruments or futures contracts. Also, we find that much of the apparent yield spread risk between callable notes and Treasurys can be explained by changes in the relationship between term and forward yields. The main steps in this process include:
• Finding the yield curve exposure in a callable note
• Structuring robust delta hedges with cash instruments
• Substituting Treasury note futures or Eurodollar futures for cash instruments
Along the way, we explain the risks in delta hedging and what can be done about them, and what to do if the note has little or no call protection.
Much of the success of this approach hinges on finding the most likely call date. For issues with a lot of call protection, the most likely call date is the first call date. For issues with little or no call protection, the most likely call date depends, among other things, on both the level and volatility of interest rates. To simplify the presentation, we begin with a comparatively simple example in which the issue has 10 years to maturity and 5 years of call protection. In this example, the issuer’s right to call at 5 years is far and away the most valuable option.
What Is the Exposure in a Callable Agency Issue?
For anyone who owns these issues, however briefly, the embedded call options can pose particularly ugly exposure problems. If interest rates fall, the likelihood that the issuing agency will redeem the note at par goes up and the note begins to behave as if it matures on the first call date rather than at the maturity. If interest rates fall enough, a 10-year note callable after 5 years would exhibit the price behavior of a 5-year note because the financial world would be confident that the issuing agency will redeem or call the note at the 5-year mark. On the other hand, if interest rates rise enough, the agency would not be expected to call the note, and the note would exhibit the price behavior of a 10-year note.
Extension and Compression Risk
The result is a note whose price rises more like that of a 5-year note when yields are low and falling and falls like that of a 10-year note when yields are high and rising. This kind of behavior, which is the worst of both worlds, can be described as either extension risk, or compression risk depending on your point of view. When yields are low and the issue is behaving like a short-term note, the risk is that yields will rise and the issue will begin to behave like a longer-term note. This is the extension risk. When yields are high, on the other hand, and the issue is behaving like a long-term note, the risk is that yields will fall, the call features will kick in, and the issue will begin to behave like a short-term note. This is the compression risk.
A Packaged Deal
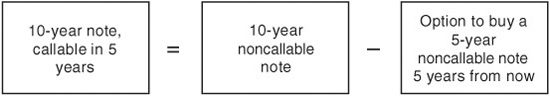
The best way to understand the risks in a callable note is to think of it as a package that combines a noncallable note with a short option on a forward note. The noncallable note’s coupon and maturity would be the same as those of the agency note. The underlying for the short option would be a noncallable note with the same coupon as the agency’s and a maturity equal to the remaining life of the agency issue at the time the option can be exercised. In Exhibit 14.2, the noncallable note has a maturity of 10 years, and the underlying for the short option is a 5-year note, 5 years forward.
A package like this is illustrated in Exhibit 14.4.
EXHIBIT 14.4
Components of Risk in a Callable Note
10-Year Note, Callable in 5 Years
What Is the Package Worth?
The value of the package is simply the sum of the values of the parts. The investor’s position is like that of someone who is long a noncallable note and short a strip of call options. As a result, to price a callable agency issue, all we have to do (in principle) is price a noncallable note with a coupon and maturity equal to that of the callable note and subtract from that the total value of the option package.
What Is the Risk Exposure?
Looking at the issue this way makes plain what has to be done to hedge it. In particular, we see that we have two kinds of instruments—one a note and one an option on a note. Also, we see that we face two different underlying sources of interest rate risk. For the agency issue in Exhibit 14.4, the price of the 10-year note is driven by the term yield on a 10-year note. The price of the embedded option is driven by the yield on a 5-year note 5 years forward. An effective hedge, then, will tackle these risks separately.
STRUCTURING A HEDGE
How you hedge such an instrument will depend on which of the risks most worry you and on whether you can lay your hands on the right hedging tools. For example, offsetting the risk in the noncallable part of the note is a comparatively straightforward task that entails little more than selling a Treasury note or non-callable agency note with a similar coupon and maturity. One also can hedge this risk with Treasury note futures or, in many instances, with strips of Eurodollar futures.
The Option Is Tougher
The most straightforward hedge for the embedded short option positions would be a long position in an identical package of options, which would be a forward-starting American-style swaption. Such a package could be purchased in the over-the-counter (OTC) market. This strategy would make sense if the objective in buying the callable notes were to profit from a mispricing of the embedded options. That is, if the embedded options were more expensive than the offsetting OTC package, the hedged position would provide a higher yield than a conventional noncallable note.
Buying an offsetting package of OTC options might not be the best strategy, however, for a dealer whose business is underwriting agency debt. Once the issue has been sold and is out the door, the underwriter no longer needs the hedge. To unwind the option part, though, the underwriter would have to sell an OTC option package identical to the one it bought as part of the hedge. And because this also has to be done in the OTC market, the underwriter would be left with both long and short OTC options and a trailing credit exposure in the long option package until it expires.
For anyone who wants a temporary hedge, the challenge is to find a hedge that adequately captures the risk in the callable note, that can be put on and taken off at low cost, and that leaves no trailing credit exposure once the need for the hedge has passed. As it is, such a hedge is too good to be true. But we can, by focusing on the sources of yield curve exposure in the note, produce delta hedges that should do a first-rate job of capturing the directional risk in a callable agency note.
Focus on Delta Hedging
In general, the directional exposure in a callable note can be expressed approximately as
Callable note exposure ≈
Noncallable note DV01 − (Embedded call delta × Forward note DV01)
where DV01 represents the dollar value of a basis point change in the underlying yield and the call delta is the delta today of the agency’s option to redeem the note at par when the no-call period is over. One good thing about writing out the exposure this way is that it underscores the separate sources of risk in the issue. A common mistake people make when hedging callable issues is to assume that noncallable and forward note yields rise and fall in parallel. With this assumption, one can calculate a hybrid DV01 for the callable note that makes it look as if it behaves like a note whose maturity is somewhere between the note’s first call date and its final maturity. And having done this, one can easily make the mistake of hedging the callable note as if it were simply a noncallable note with a shorter maturity.
We know, however, that parallel shifts in the yield curve are an exception rather than the rule. The only hedges that will prove effective in the face of yield changes while the curve is steepening or flattening are those that address the separate sources of risk separately.
Consider, for example, a 10-year issue that is callable in 5 years. Suppose, too, that the embedded call is around the money so that its delta is 0.50. In a case like this, the directional risk in $10 million of the callable issue would be the same as the directional risk in a long position of $10 million of a noncallable 10-year note combined with a short position of, say, $5 million of a 5-year note 5 years forward. The best way to hedge the directional exposure in this case would be to sell $10 million of a 10-year noncallable note and to buy $5 million of a 5-year noncallable note 5 years forward. In both cases, the spot and forward notes would have coupons equal to the callable note’s coupon. Done this way, the hedge provides protection against the 10-year bullet exposure and against the callable note’s exposure to changes in 5-year rates 5 years forward.
Synthetic Forward Notes
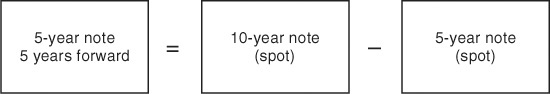
The main hurdle to doing this hedge is that there is not much of a market for the forward note the hedger needs to put this kind of delta hedge together. A substitute for the missing security, however, is fairly easy to create. As shown in Exhibit 14.5, the equivalent of a 5-year note 5 years forward can be constructed by combining a long position in a 10-year note with a short position in a 5-year note.
EXHIBIT 14.5
Constructing a Synthetic Forward Note
The effect of using the synthetic equivalent of the forward note is illustrated in Exhibit 14.6 for a case in which the delta of the embedded call is 0.5. Hedge 1 shows the direct hedge, which deals with the problem by offsetting each source of exposure separately. The 10-year exposure is hedged by selling $10 million of a noncallable 10-year note, and the exposure to the 5-year note 5 years forward is hedged by buying $5 million of the 5-year note 5 years forward. Such a hedge would leave the position with no directional exposure.
EXHIBIT 14.6
Alternative Hedges for a 10-Year Note Callable in 5 Years
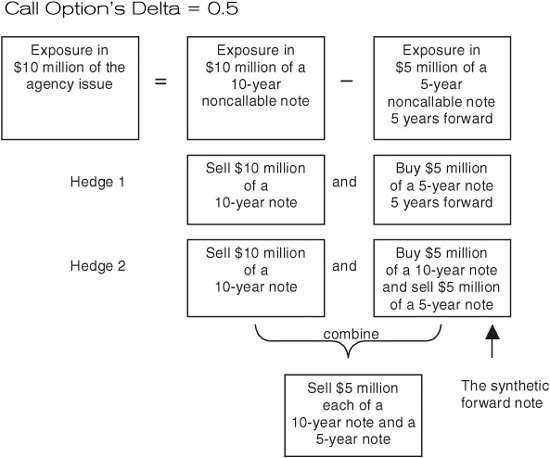
Hedge 2 shows what happens if we substitute a long position in a synthetic forward note for the actual forward note. In this case, the synthetic forward would include a long position of $5 million in a 10-year note and a short position of $5 million in a 5-year note instead of a long position of $5 million in a 5-year note 5 years forward. If we buy the synthetic note, notice that the $5 million of the 10-year note that we buy to construct the synthetic forward note offsets half of the $10 million of the 10-year note that we would sell to hedge the exposure to the 10-year noncallable note. Netting the two, we find that we can sell just $5 million of the 10-year note. And, if we do, the combined net hedge would comprise short positions of $5 million each in the 10-year and 5-year notes.
This is not the same, of course, as selling $10 million of something like a 7.5-year note, even though the average maturity or duration may be the same as that of the best hedge. By selling 10s and 5s, the hedger captures exposure to changes in the slope of the yield curve as well as to changes in the general level of yields.
Different Deltas
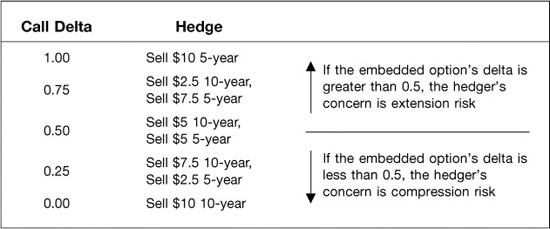
This kind of financial algebra is extremely useful for constructing economical and effective hedges. Consider how things look if the embedded call delta is 1.00. In this case, yields are so low that there is no question in anyone’s mind (at least not in the mind of anyone in the options market) that the issuing agency will redeem the note at the first possible opportunity. If this is the case, then the market will trade the agency issue as if it were a 5-year note. If you wanted no directional price exposure, you would have to sell $10 million of a noncallable 5-year note.
Or suppose that the call’s delta is 0.25. In this case, yields are high and the likelihood that the issuing agency will call the note is about one in four. As a result, the note is behaving as if it were a combination of $7.5 million of a 10-year noncallable note and $2.5 million of a 5-year noncallable note. In this case the hedger would have to sell $7.5 million of a 10-year note and sell $2.5 million of a 5-year note.
If the call’s delta is zero, the option market’s guess is that the agency will never call the note. In this case, the market will treat the issue as if it were a 10-year noncallable note, and it can be hedged simply by selling $10 million of a 10-year note.
In general, as the marginal comments in Exhibit 14.7 indicate, the kind of risk the hedger faces hinges on the delta of the embedded call. If the embedded call’s delta is greater than 0.50 because interest rates are low, then the issue is behaving mainly like a 5-year note, and the hedger is concerned with extension risk. On the other hand, if the delta is less than 0.50 because interest rates are high, then the issue is behaving more like a 10-year note, and the hedger’s big concern is compression risk.
EXHIBIT 14.7
Delta Hedges for $10 Million of a Callable Agency Note 10-Year Maturity, Callable in 5 Years
EXAMPLE OF HEDGING A 10-YEAR, 8.5 PERCENT COUPON NOTE, CALLABLE IN 5 YEARS
A lot can be learned by working through an example of how one would construct a hedge. For this example, we will work with a 10-year, 8.5 percent coupon note with 5 years of call protection. This resembles the FNMA global issue that was brought to market in January 1995. The steps in finding the hedge are:
• Find the forward price of the note underlying the embedded call
• Find the embedded option’s delta for changes in the forward price
• Calculate spot market hedge ratios
• Calculate futures hedge ratios
• Adjust the hedge as interest rates change
All of the information we need to work through this example is displayed in Exhibit 14.8, which shows how to price a forward note using spot bullet issues, and Exhibit 14.9, which is an example of our hedge report.
EXHIBIT 14.8
How to Price a Forward Note
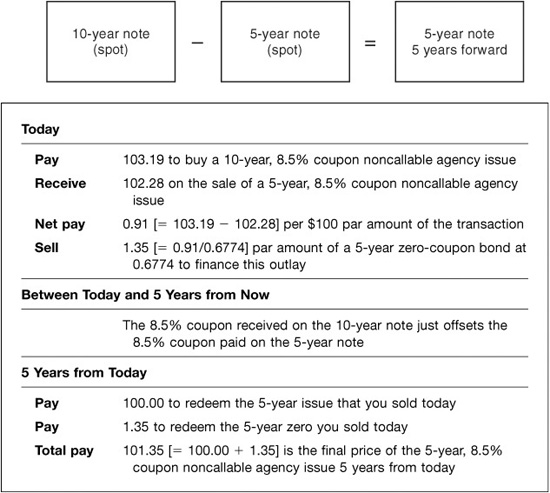
Step 1: Find the Price of the Forward Note
To value the embedded call option, you have to know the price of the underlying, which is a 5-year note, 5 years forward. That is, you have to know how much you would pay 5 years from now for a note with the appropriate coupon and that matures 5 years later, or 10 years from now. To find this price, consider what it would cost to construct such a note using noncallable 5-year and 10-year notes. As shown in Exhibit 14.8, the price of a 5-year, 8.5 percent noncallable note yielding 20 basis points over the 5-year Treasury yield of 7.74 percent on January 20, 1995, is 102.28 (decimal). The price of a 10-year, 8.5 percent coupon noncallable note yielding 27 basis points over the 10-year Treasury yield of 7.76 percent is 103.19. Note, too, that the price of a 5-year, zero-coupon issue is 67.74 per $100 par amount.
At these prices, you can construct today a synthetic 5-year, 8.5 percent coupon note 5 years forward by buying the 10-year issue and selling the 5-year issue. At the prices on January 20, this would require a net cash outlay of $0.91 [= 103.19 − 102.28] per $100 face amount of the transaction. For the purposes of this exercise, you would finance this cash outlay by selling a 5-year zero-coupon bond, which allows you to borrow for 5 years without making any cash interest payments between now and 5 years from now. As shown in Exhibit 14.8, you would have to sell $1.35 [= 0.91/0.6774] par amount of the zero to cover the difference in the two prices. Notice that because you borrow the difference between the purchase of the 10-year note and the sale price of the 5-year note, your net cash outlay today is zero.
For the next 5 years, the two coupon streams just offset one another. That is, the coupon income on your long position in the 10-year bullet just covers the coupon outlay on your short position in the 5-year bullet.
At the 5-year mark, you have to pay out two amounts of money—$100.00 to cover the bullet payment on the 5-year note that you sold at the outset and $1.35 to redeem the zero-coupon bond that you sold. Taken together, your total cash outlay in 5 years is $101.35 per $100 par amount, and you are left with the last 5 years of the original 10-year issue.
The price, then, of the noncallable 5-year, 8.5% coupon note 5 years forward is simply $101.35. This is the price of the underlying that we plug into an option pricing model to find the embedded call’s delta.
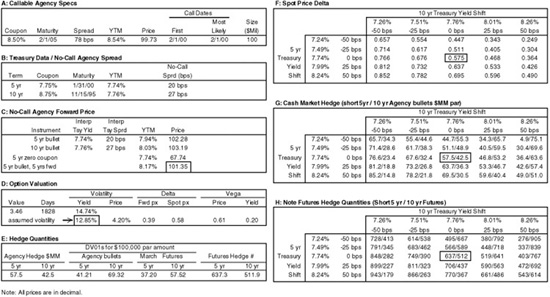
Before we do this, though, it is important to lay out the relationship between this forward price and the spot prices of the notes used in the forward note’s construction. In particular, we can write the price of the forward note as
where 100 is the par value of the note. The expression in brackets is the forward value of the difference between the spot prices of the 10-year and 5-year notes. This expression will prove to be especially useful because it is the link between the price of the forward note that underlies the embedded option and the spot prices of the notes we will use to construct the actual delta hedge.
Step 2: Find the Embedded Option’s Delta
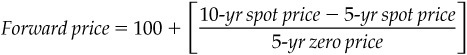
To calculate the option’s delta, we need a measure of the implied volatility of the 5-year forward note’s price. We can get a first approximation of this by comparing the price of the callable note, which is 99.73 (or 99–23/32nds) in this example, with the price of a 10-year noncallable note, which is 103.19. These prices are shown in panels A and C of Exhibit 14.9. The difference between the two, or 3.46, is what the issuing agency is paying for the right to call the note and is shown as the value of the option in panel D. Using 3.46 as the option price, 101.35 as the price of the underlying forward note, and the Black model for pricing European calls on forwards, we get an implied price volatility of 4.84 percent. This level of price volatility corresponds to a yield volatility for the forward note of 14.74 percent.
EXHIBIT 14.9
Callable Agency Hedge: 10-Year Callable in 5
Trade January 20, 1995, Settlement January 30, 1995
In practice, we want to use a slightly smaller implied volatility for calculating the option’s theoretical delta. This is because the issuing agency has more than a simple European call on the issue at 5 years. Rather, the agency has a string of options that allow it to call the note almost any time between 5 years and maturity. These “backup” calls contribute a small amount to the value of the package of calls. For this example, we make a reasonable allowance for their contribution and use an implied volatility of 4.20 percent, or a yield volatility of 12.85 percent, for calculating the delta of the first—and most important—of the note’s embedded call options.
With these assumptions, we find that the option’s delta for changes in the forward note’s price is 0.39. That is, a $1 increase in the forward price of the forward note would increase the value of the embedded call by $0.39. This delta may seem small for an option that is in the money, but the delta represents the change in the present value of the right to exercise the option. If we were close enough to the call date, the delta would be greater than 0.50, but 5 years of discounting reduces the present value a great deal.
If we plan to use 5-year and 10-year bullet notes, however, we need a measure of the embedded option’s spot price delta. That is, we need to know the change in the value of the option for a $1 change in the prices of the 5-year and 10-year notes. To find the spot price deltas, all we need is the linkage between the spot and forward prices, which we already know is:
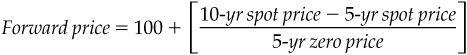
From this, we see that a $1 increase in the spot price of the 10-year note increases the forward price by $1 divided by the price of a 5-year zero. In our example, this would be 1.48 [= $1.00/$0.6774]. Chaining this together with the option’s forward price delta of 0.39, we find that the option’s spot price delta is 0.58 [= 0.39 × 1.48] for changes in the price of the 10-year note. Similarly, we see that a $1 increase in the spot price of the 5-year note decreases the forward price by $1.48. As a result, the option’s spot price delta for changes in the price of the 5-year note would be −0.58 [= 0.39 × −1.48]. The only difference between the deltas for changes in the 10-year and 5-year notes’ prices is the sign. In general, the option’s spot deltas are simply
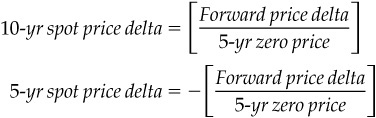
where the forward price deltas are the standard output from an option pricing model.
Step 3: Calculate Spot Market Hedge Ratios
Now we can use the simple hedge algebra illustrated in Exhibit 14.6. The owner of this callable note can think of it as a long position in an 8.5 percent coupon, 10-year noncallable note together with a short call option on an 8.5 percent coupon, 5-year note, 5 years forward. With spot deltas of 0.58 for the 10-year note and −0.58 for the 5-year note, the effect of being short the embedded call is like that of selling 0.58 of the 10-year note and buying 0.58 of the 5-year note. Thus, the investor’s net exposure in the callable note can be summarized as
10-yr note exposure = 1.00 − 0.58 = 0.42
5-yr note exposure = 0.00 + 0.58 = 0.58
In other words, the risk exposure in $100 million of the callable note is like the risk exposure in a position that combines $42 million of the 10-year noncallable note with $58 million of the 5-year noncallable note.
And, if our interest in hedging the callable note is to remove any directional exposure to changes in 5-year and 10-year interest rates, we would sell $42 million of the 10-year noncallable note and sell $58 million of the 5-year noncallable note. This hedge, with slightly greater precision, is shown in the center of panel G of Exhibit 14.9.
As a reasonableness check, we should satisfy ourselves that these measures of risk exposure make sense. We know that the forward note price is above par so the issuer’s call option is in the money. As a result, the callable note should tend to behave more like a 5-year note than a 10-year note. Thus, finding that the risk equivalent of the callable note is $58 million of a 5-year note and $42 million of a 10-year note should seem right.
Step 4: Calculate Futures Hedge Ratios
The spot hedges in Step 3 would be done with noncallable agencies or Treasury notes with appropriate coupons and maturities. The next step is to do the best possible job of hedging the position with futures. In some cases, especially those involving maturities over 5 years, the best available hedging tools would be Treasury note futures. In other cases, especially those involving issues with shorter maturities or those with little or no call protection, Eurodollar futures can provide a better match. In all cases, though, the problem of hedging with futures comes down to nothing more than replicating adequately the 5-year and 10-year bullets with futures.
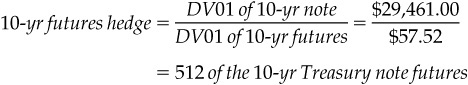
This example provides a good opportunity to use Treasury note futures. We can, for example, sell 10-year Treasury note futures as a reasonable proxy for selling the 10-year noncallable note. And we can use 5-year Treasury note futures in lieu of selling the 5-year noncallable note. To find the appropriate number of contracts in each case, we simply calculate the standard hedge ratios for each issue. For example, the 8.5 percent coupon 5-year noncallable note has a dollar value of a basis point (DV01) of $41.21 per $100,000 face amount. The DV01 for $57.5 million of this issue would then be $26,695.75 [= $57,500,000 × ($41.21/$100,000)]. As shown in panel E, the DV01 of a single 5-year Treasury note futures contract on January 20 was $37.20. Thus, the number of 5-year note futures that we would need in place of the 5-year notes would be
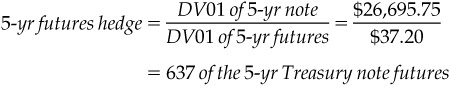
which we would short. Similarly, with a DV01 of $29,461.00 [= $42,500,000 × ($69.32/$100,000)] for $42.5 million of an 8.5 percent coupon, 10-year noncallable note, and a DV01 of $57.52 for a 10-year Treasury note futures contract, the 10-year note futures hedge would be
These hedge ratios are shown as a pair of numbers in the center of panel H in Exhibit 14.9.
Step 5: Adjust the Hedge as Interest Rates Change
Any change in the price of the forward note will cause the delta of the embedded call to change. For example, if the forward note price rises, the call delta increases, and we will have to adjust our hedge to include more 5-year notes and fewer 10-year notes. If the forward price falls, the call delta decreases, and we will have to reduce our 5-year note position and increase our 10-year note position to reflect the change.
The hedge pairs in Exhibit 14.9 provide some indication of how the hedge ratios would change in response to changes in the spot yields of the 10-year and 5-year notes that we use to construct the synthetic forward.
Consider what happens, for example, if the 10-year yield rises while the 5-year yield remains unchanged. If this were to happen, the yield on a 5-year note 5 years forward would rise and the price of the forward note would fall. This would cause the embedded option’s delta to fall, causing the callable issue to behave more like a 10-year note and less like a 5-year note. In Exhibit 14.9, we find that if the 10-year noncallable note’s yield were to increase 25 basis points while the 5-year noncallable note’s yield is held fixed, the appropriate hedge would be 519 of the 5-year note futures and 641 of the 10-year note futures. In other words, because of a decrease in the likelihood of call, the note would behave more like a 10-year note and less like a 5-year note. The decrease in the number of 5-year futures and the increase in the number of 10-year futures reflects this shift in behavior.
In contrast, an increase in the 5-year note’s yield with no change in the 10-year note’s yield would cause the forward note’s yield to fall. The resulting increase in the forward note’s price would cause the embedded call’s delta to rise and would, as a result, tip the hedge more towards 5-year note futures and away from 10-year note futures. For example, if the 5-year note’s yield were to increase 25 basis points with no change in the 10-year note’s yield, the new hedge pair would include 706 5-year note futures and 437 10-year note futures.
THE COSTS AND RISKS OF DELTA HEDGING
The main costs of delta hedging a short option are incurred when rebalancing the hedge. For example, an increase in the 5-year note’s yield would cause the hedger to sell more 5-year notes and to scale back the short position in 10-year notes. Similarly, a decrease in the 5-year note’s yield would cause the hedger to scale back the short position in 5-year notes and to sell additional 10-year notes.
Only some of this rebalancing is costly. For example, an increase in the 5-year note’s yield forces the hedger to sell more 5-year notes, and these must be sold at a lower price. On the other hand, if it is only the 5-year note’s yield that has changed, the price of the 10-year notes that the hedger has to buy is the same as it was. The only cost of transacting in the 10-year notes would be transactions costs.
And, to the extent changes in 5-year and 10-year note yields are correlated, at least some of the hedge rebalancing will actually be done at favorable prices. Consider what happens, for instance, if 5-year and 10-year note yields both increase 25 basis points. As shown in Exhibit 14.9, this increase would force the hedger to buy 47 [= 637 − 590] 5-year note futures and to sell 51 [= 563 − 512] 10-year note futures. Because both futures prices will have fallen with the rise in 5-year and 10-year note yields, the cost of having to sell the 10-year futures at a lower price is offset somewhat by being able to buy the 5-year contracts at a lower price.
In any case, the costs of delta hedging the note are offset by the time decay earned on the short options embedded in the callable note.
Risks in the Hedge
Delta hedging an option is risky business for at least two reasons. First, delta hedges do not capture the gamma in the option. As a result, a large, unexpected change in the underlying price can produce large hedge errors. Because the investor in the callable note is short the embedded call, the gamma in the position is negative. Any large rate changes, then, hurt the investor.
Second, delta hedges afford no protection against changes in implied volatility. Because the investor is short the embedded call, any increase in implied volatility increases the value of the call and reduces the value of the callable note. In Exhibit 14.9 panel D, the callable note is shown to have a price vega of 0.61 and a yield vega of 0.20. That is, an increase in implied price volatility from 4.20 percent to 5.20 percent would increase the value of the issuer’s call option by 0.61. Or, an increase in implied yield volatility from 12.85 percent to 13.85 percent would increase the value of the call by 0.20.1
At least some of these risks can be offset by including some long options in the hedge. Long options would bring with them positive gamma, which would help offset the risks of large and unexpected price changes. Long options would also afford some protection against increases in implied volatilities. The chief difficulties in using options lie in their availability. The long-dated options on forward bonds or swaps that would provide the right mix of gamma, vega, and theta are available only in the over-the-counter market. The short-dated options that trade on the Chicago exchanges can be used to offset gamma exposure but their relatively small vegas would do little to offset the implied volatility exposure in the callable notes.
THE YIELD SPREAD BETWEEN AGENCIES AND TREASURYS
Some hedgers worry about not being able to hedge changes in the yield spread between callable notes and Treasurys. The approach to hedging that we take here, however, makes it possible to hedge much of the apparent risk in this spread. The reason is that much of the yield spread reflects nothing more than the value of the embedded call options. And if we can hedge the embedded calls, then we can hedge that part of the yield spread risk that is produced by changes in the values of the embedded calls.
The yield spread between a callable agency note and a Treasury note with the same maturity reflects two main differences between the two notes. One is the apparent credit of the issuer. However badly our country manages its fiscal affairs, the U.S. Treasury is less likely to default than are any of the Federal financing agencies. This difference is reflected in the higher yields paid on non-callable agency bullet issues.
The other difference is in the call features. The holder of the callable note pays a lower price for the callable note as compensation for giving the agency the right to call the note. The result of the lower price is a seemingly higher yield to maturity. As a result, anything that increases the value of the embedded calls should increase the callable note’s yield spread over Treasurys.
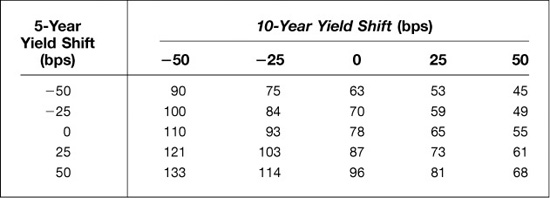
In particular, consider an increase in the yield on the 5-year note with no change in the yield on the 10-year note. Such a change would cause the yield on the 5-year note 5 years forward to fall and the forward price of the note to rise. The embedded calls would increase in value, the price of the callable note would fall, and its measured yield to maturity would rise. Thus, even with no change in the bullet spreads over Treasurys, the yield spread between the callable note and a 10-year Treasury note would increase. In Exhibit 14.10, we see that a 25-basis point increase in the yield of the 5-year note with no change in the yield of the 10-year note would increase the spread over 10-year Treasurys from 78 to 87 basis points.
EXHIBIT 14.10
Callable Agency Yield Spread over 10-Year Treasury 8.5 Percent Coupon, 10-Year Callable in 5 Yield Spread in Basis Points
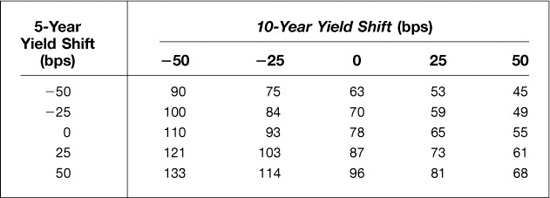
Similarly, any decrease in the yield on the 10-year note with no change in the yield on the 5-year note would decrease the yield on the forward note and, as a result, increase its price. The resulting increase in the value of the embedded calls would increase the agency’s spread over 10-year Treasurys. In Exhibit 14.10, we find that a 25-basis point decrease in the yield of the 10-year note would increase the callable note’s yield spread from 78 to 93 basis points.
WHAT IF THERE IS LITTLE OR NO CALL PROTECTION?
The problem of hedging a 10-year note that has 5 years of call protection is comparatively easy because the most valuable of the agency’s rights to call the note is the very first option. As a result, even though the agency’s right to call the note any time after 5 years is worth something to the agency, the hedger can ignore these backup options and treat the note as if it could only be called at the 5-year mark without any really serious consequences to the effectiveness of the hedge.
In many cases, however, the note that one wants to hedge has little or no call protection. What should one do then?
The main question is this. If the agency can call the 10-year note anytime, what is the appropriate underlying for the embedded call option? The answer is that it depends. The agency, for example, has the right to call the note 1 year from now. For this particular option, which has 1 year to expiration, the underlying is a 9-year note 1 year forward. The agency also has the right to call the note 3 years from now. For this option, which has 3 years to expiration, the underlying is a 7-year note 3 years forward. Which of these is the more valuable option? The option to call the note in 1 year benefits from having an underlying note whose price is relatively volatile for any given level of yield volatility. But the option itself only has 1 year to expiration. The option to call the note in 3 years suffers from having an underlying—a 7-year note 3 years forward—whose price is less volatile than that of the 9-year note underlying the 1-year option. But the option has more time to expiration.
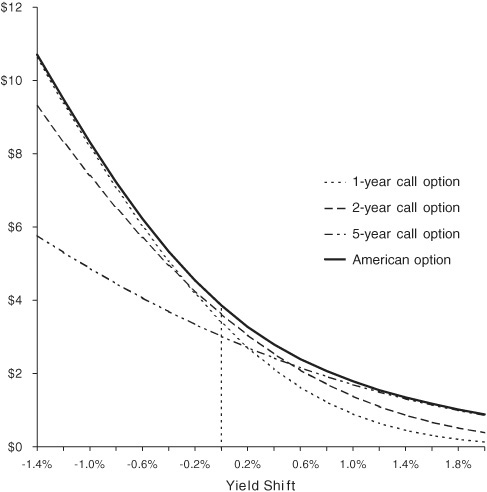
Which of these is the more valuable option depends to a large extent on the level of rates. As shown in Exhibit 14.11, if yields are low enough, the agency can be counted on to call the note at the earliest opportunity. The most valuable option would be the option with the nearest expiration, which in this example would be the option to call in 1 year. If yields are high enough, on the other hand, the most valuable option would be a longer-dated option on a shorter maturity note. In Exhibit 14.11, the most valuable option is the right to call the note in 2 years. At higher yields still, the most valuable option might be the right to call the note in 5 years.
EXHIBIT 14.11
Value of American Option versus European Options
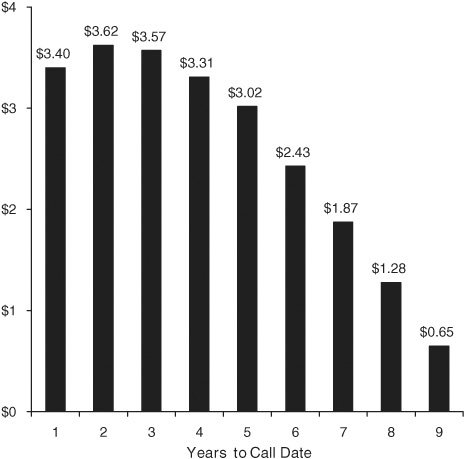
For any given level of yields and yield volatilities, then, there is one option that is more valuable than all the others. In Exhibit 14.12, which shows the values of the option to call the note at various points throughout the note’s life, we find that the most valuable option is the agency’s right to call the note in 2 years. For this particular setting, then, the agency is most likely to call the note in 2 years. And because the delta of the agency’s European-style option to call the note in 2 years is very close to the delta of the American-style option that comprises all of the agency’s call options (see Exhibit 14.11), we can hedge the note as if this were the only option embedded in the note. If we do, our task is to price an 8-year note 2 years forward, value the embedded option, find its delta, and construct an appropriate delta hedge along the lines laid out in this note.
EXHIBIT 14.12
European Call Option Values No Call Protection
As rates rise or fall, one can expect shifts in the most likely call date and corresponding shifts in the appropriate underlying for the embedded call. As rates fall, for example, we would find the underlying shifting away from an 8-year note 2 years forward to a 9-year note 1 year forward. As rates rise, on the other hand, we find the underlying shifting toward a 7-year note 3 years forward. It is easy enough to adjust the hedges to suit changing circumstances.
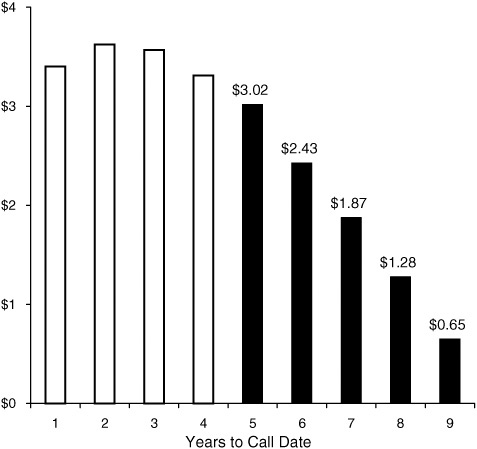
Exhibit 14.13 illustrates the value of call protection. If the agency provides 5 years of call protection on a 10-year note, for example, it gives up the most valuable of the call options. The exhibit also shows that the most valuable of the remaining options is the right to call the note at the 5-year mark, which is the first possible opportunity. The values of the backup options trail off fairly quickly. And, because they would come into play only at very high yields or high implied volatilities, these backup options can be ignored without doing serious harm to our hedge constructions. Thus, if the note has enough call protection, the business of hedging the note is simplified considerably.
EXHIBIT 14.13
European Call Option Values 5 Years of Call Protection
SOMETIMES STRIPS OF EURODOLLAR FUTURES PROVIDE BETTER HEDGES
Eurodollar futures offer clear-cut advantages in many cases. They are especially well suited to hedging notes that have less than 5 years to maturity or for which the most likely call date is under 5 years. Eurodollar futures hedges can be easier to maintain in the face of changing yield levels and changing yield curve slopes. Also, hedging with Eurodollar futures may offer an added advantage by capturing some of the credit spread between yields on bullet agency issues and on Treasury notes.
An example of what a Eurodollar hedge for an agency issue would look like is provided in Exhibit 14.14. The hedge is for $10 million of a 3-year 6.8 percent coupon note callable in 2 years. In this case, the embedded call is out of the money so that its delta is less than 0.50. As a result, the note behaves more like a 3-year than a 2-year note. And, for the purposes of this illustration, one would hedge it by shorting $6.8 million of a 3-year note and $3.2 million of a 2-year note.
EXHIBIT 14.14
Hedging with Eurodollar Futures 3-Year Callable Note with 2 Years of Call Protection
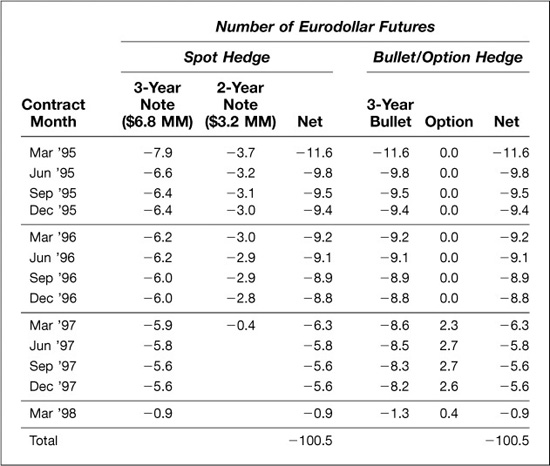
Netting Positions
Exhibit 14.14 provides two different ways of interpreting the hedge that one would construct using Eurodollar futures. In the left hand part of the exhibit, we show the number of Eurodollar contracts, by expiration month, that one would short instead of shorting the bullet issues. The weighted strip of Eurodollar futures with expirations extending out to March ′98 would capture fully the rate exposure of a short position of $6.8 million of the 3-year note. The weighted Eurodollar strip with expirations reaching out to March ′97 would stand in for a short position of $3.2 million of the 2-year note. Adding them together provides the combined strip shown under the “Net” column.
One could arrive at exactly the same answer by hedging the components of the note separately. That is, the callable note can be thought of as a 3-year bullet combined with a 2-year option on a 1-year note, 2 years forward. In the right-hand part of Exhibit 14.14, we show the hedges for these two components. To hedge the bullet part of the exposure, we would short the weighted strip of Eurodollar futures shown in the 3-year bullet column. The underlying for the embedded option is a 1-year note 2 years forward. Given the option’s delta, we can offset this delta by buying a strip of Eurodollar futures beginning with the March ′97 contract and extending out to include the March ′98 contract. Notice that when we add these two hedges together, the combined net hedge is exactly the same as the hedge shown in the left hand part of the exhibit.
Adjusting the Hedges
Exhibit 14.15 shows how Eurodollar futures can simplify the problem of adjusting to changing market conditions. In this example, to make things especially interesting, we consider an issue that has no call protection at all. The left-hand panel shows what the hedge for a 3-year 6.8 percent coupon note with no call protection would look like at the current level of interest rates. In this instance, the most likely call date is 1.5 years away and the Eurodollar futures used to hedge the embedded call begin with the September ′96 contract.
EXHIBIT 14.15
Hedging with Eurodollar Futures 3-Year Callable Note with No Call Protection
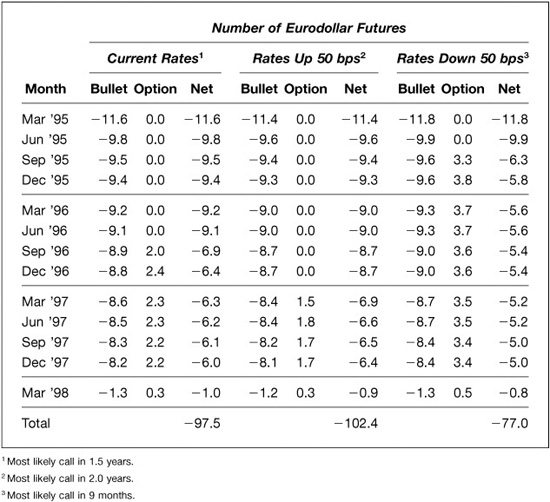
Two things happen to the hedge as rates rise or fall. For one thing, the price sensitivity or DV01 of the bullet component of the agency note changes—falling as rates rise and rising as rates fall. As a result, if rates rise 50 basis points, we need fewer contracts to hedge the bullet, and if rates fall 50 basis points, we need more.
For another thing, the most likely call date and the option delta change. For example, if rates rise 50 basis points, the most likely call date is extended to 2 years and the delta declines. If rates fall 50 basis points, the most likely call date is brought forward to 9 months and the delta increases. As a result, a change in rates changes both the number and expirations of the contracts needed to hedge the embedded call options.
Taken together, an increase in rates would increase the hedger’s net short position by about 5 contracts. As a practical matter, 4 of these 5 would be sold to increase the hedger’s short position in September ′96 and December ′96. A decrease in rates would reduce the hedger’s short position by about 20 contracts. Most of this adjustment would be made by buying 3 or 4 contracts in each of the contract months from September ′95 through December ′96, with the remainder made up in later months.
In either case, adjusting the Eurodollar hedge is simpler than adjusting a cash market hedge, which requires three separate transactions. For example, if the most likely call date falls from 1.5 years to 9 months, the hedger would have to reduce the size of the short position in the 3-year bullet, cover entirely the short position in the 1.5-year bullet, and short a 9-month instrument. This would almost certainly be more expensive than simply adjusting the Eurodollar hedge.