
CHAPTER 25
What Happens to Eurodollar Volatility when Rates Fall?
We find that basis point volatility in the Eurodollar market has, for the past 10 years, been largely unrelated to the level of interest rates. As a result, we think that basis point volatility, as opposed to conventional relative rate volatility, is a better measure of volatility.
BACKGROUND
In the wake of the September 11 attack on the World Trade Center, implied Eurodollar rate volatility went through the roof. At the same time, Eurodollar rates fell a lot, raising questions about how one should interpret a volatility like 46.9 percent, which is the level at which implied relative rate volatility for at-the-money Dec ′01 Eurodollar options peaked on September 19.
Exhibit 25.1 provides some help in answering these questions. On September 10, the day before the attack, implied relative rate volatility for Dec ′01 options closed at 22.5 percent. Given an underlying futures rate of 3.29 percent for the Dec ′01 contract, implied basis point volatility for the Dec ′01 contract was 74 basis points [= 0.225 × 3.29]. At the peak volatility of 46.9 percent, implied basis point volatility reached 116 basis points [= 0.469 × 2.48]. By October 4, when things had begun to settle down, an implied relative rate volatility of 29.0 percent produced an implied basis point volatility of only 67 basis points.
EXHIBIT 25.1
Key Rate Levels versus Dec ′01 Implied Rate Volatility September 10, 2001, to October 4, 2001
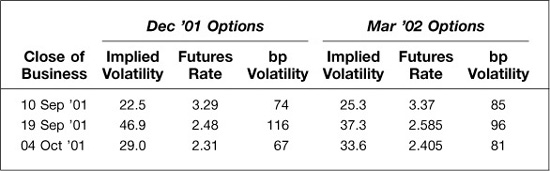
In other words, on September 19, implied relative rate volatility and implied basis point volatility were both higher than before the attack. By October 4, implied relative rate volatility was higher but implied basis point volatility was lower than before the attack.
WAS VOLATILITY RICH OR CHEAP?
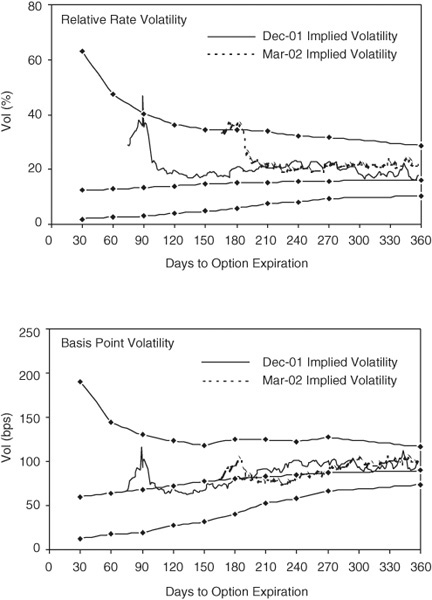
Whether Eurodollar options were rich or cheap before and after the attack depends on whether you think relative rate volatility or basis point volatility is the better measure of volatility. We produce volatility cones for both measures, and it is apparent from Exhibit 25.2 that the two views are quite different. On September 19, implied relative rate volatility at 46.9 percent was outside of the cone and would be considered rich (see upper panel). On the same day, implied basis point volatility was certainly high, but was still within the range of historicals for the past 2 years (see lower panel). And by October 4, implied relative rate volatility still appeared somewhat rich, while implied basis point volatility was back to or somewhat below normal.
EXHIBIT 25.2
Eurodollar Volatility Cones 2-Year History as of Close of Business October 4, 2001
VOLATILITY AND RATE LEVELS
The main purpose of this note is to shed some light on the relationship between interest rate volatility and the level of interest rates.
What we find is that while it is customary in the Eurodollar options market to quote rate volatility as a relative rate volatility—that is, as a change in the rate divided by the rate—the evidence suggests that basis point volatility provides a better measure of whether options are rich or cheap.
WHY RELATIVE RATE VOLATILITY?
The custom in the Eurodollar options market is to express or quote volatilities as relative rate volatilities. A 25-basis-point cut in rates from 6.00 percent to 5.75 percent would be expressed either as a decrease of 4.17 percent [= -0.25/6.00] or as a decrease of 4.26 percent [= Ln (5.75/6.00)]. The same basis point cut in rates from 3.00 percent to 2.75 percent, though, would be 8.34 percent or 8.25 percent.
There are at least three reasons for thinking of Eurodollar rate volatility this way.
1. It makes sense. When rates are high, changes in rates should be high. And when rates are low, changes in rates should be low.
2. If rate changes are proportional to the level of rates, then interest rates can never be negative. Recent Japanese experience perhaps suggests that interest rates can be negative, but there must be some limit to how negative they can be.
3. Conventional option pricing models use relative changes as inputs. The standard closed form models rely heavily on the use of lognormal distributions. And so it is a matter of computational convenience to use relative rate volatilities when pricing Eurodollar options.
WHAT IS THE EVIDENCE?
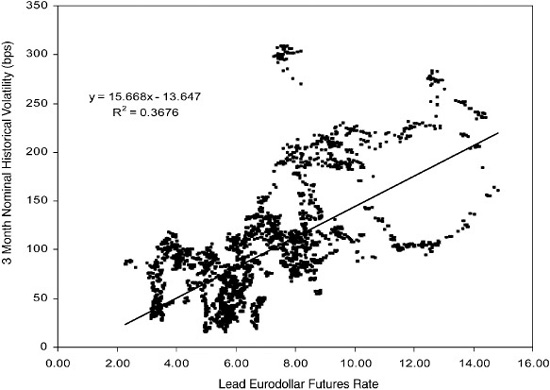
The evidence is mixed. Consider Exhibit 25.3, for example, which shows the relationship between the annualized standard deviation of basis point changes in the lead Eurodollar rate and the level of the lead Eurodollar rate from 1983 to October 2001. Over this period, rates ranged from just over 2 percent (recently) to over 14 percent (in the early 1980s). The scatter has an upward sweep to it, and the regression line is positively sloped. The slope coefficient of 15.7 indicates that, on average over this period, the standard deviation of basis point changes rises 15.7 annualized basis points with each 1 percent increase in the level of rates. The R2 of 0.37 suggests, however, that the relationship is weak and bears out what is evident to the eye in the loose scatter plot.
EXHIBIT 25.3
Eurodollar Rate Levels and Basis Point Volatilities 1983 to October 4, 2001
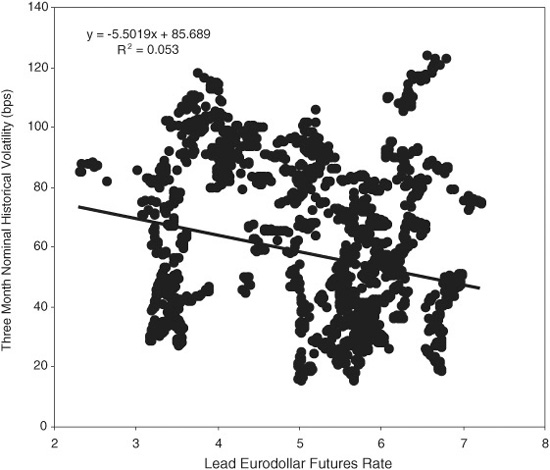
Now consider Exhibit 25.4, which shows what the relationship has looked like since December 6, 1990, when rates fell below 8 percent and stayed below 8 percent. Over this period, rates have traded between 2 percent and 7 percent, which is still a considerable range, and there seems to be no relationship at all between basis point volatility and the level of rates. The regression line even has a slight negative slope, which means nothing much given the R2 of 0.05.
EXHIBIT 25.4
Eurodollar Rate Levels and Basis Point Volatilities December 6, 1990, to October 4, 2001
IS IT THE FED?
Probably. The tension between the relative and basis point views of rate volatility is due, at least in part, to the way the Federal Reserve changes rates. It would be one thing if the Fed’s standard practice were to change rates, say, by 5 percent of the level of rates. If they did this, they would cut rates by 30 basis points if the level of rates were 6 percent and by 15 basis points if the level of rates were 3 percent. As it is, the Fed’s practice has been to cut rates in multiples of 25 basis points no matter what the level of rates. Thus, it should be no surprise that the market looks at rate volatility in absolute or basis point terms rather than in relative terms.
PRACTICAL CONSEQUENCES
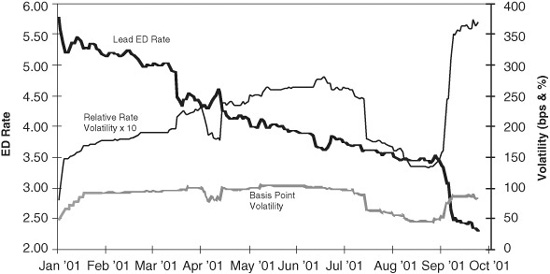
Just why the Fed does what it does may be rooted in its understanding about the way monetary policy translates into economic activity. If basis point volatility is unrelated to the level of interest rates, then relative rate volatility is inversely proportional to the level of rates. A halving of rates from 6 percent to 3 percent can be expected to double relative rate volatilities. This is borne out in Exhibit 25.5, which shows that basis point volatility has been fairly stable between 50 and 100 annualized basis points for most of 2001, while relative rate volatility has roughly doubled.
EXHIBIT 25.5
Relative and Basis Point Rate Volatilities January through October 2001
As a result, we cannot reasonably compare relative rate volatilities, either historical or implied, taken from a period when rates were around 6 percent and use them as a standard of richness or cheapness now that rates are trading around 3 percent and lower.
For this reason, we have produced a new set of volatility lines for money market contracts that compare implied basis point volatility [= Implied relative rate volatility × Rate level] with the historical distribution of historical basis point volatilities. (See lower panel of Exhibit 25.2.) We think these basis point volatility cones will be more reliable tools for gauging option richness or cheapness.