
Example with Nonsignificant Differences between Experimental Conditions
In this section, you repeat the preceding analysis, but this time you perform it on a dataset that was designed to provide nonsignificant results. This will help you learn how to interpret and summarize results when there are no significant between group differences.
Data for the New Analysis
Here is the dataset to be analyzed in this section of the chapter:
DATALINES;
1 15
1 17
1 10
1 19
1 16
1 18
2 14
2 17
2 16
2 18
2 11
2 12
3 17
3 20
3 14
3 16
3 16
3 17
;
RUN;
Remember that the first column of data (in column 1) of the preceding dataset represents each participant’s score on REWARDGROUP (i.e., the type of rewards independent variable). The second column of data in columns 3 to 4 represents each participant’s score on COMMITMENT (i.e., the dependent variable).
Results from the SAS Output
If the preceding dataset were analyzed using the PROC GLM program presented earlier, it would again produce four groupings of information, here presented as separate pages. The output from this analysis is reproduced as Output 9.2.
Output 9.2. Results of One-Way ANOVA: Nonsignificant Differences Observed
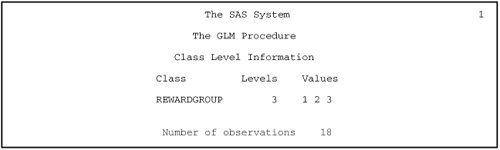

Page 1 of Output 9.2 provides the class level information, which again shows that the class variable (REWARDGROUP) includes three levels. In addition, page 1 indicates that the analysis is again based on 18 observations.
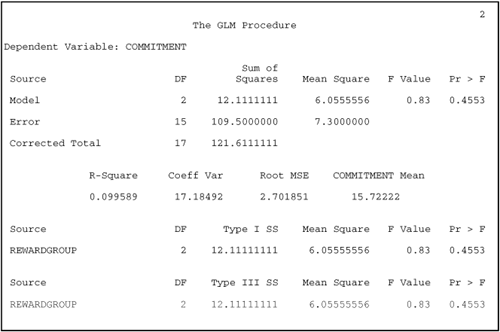
Page 2 of Output 9.2 provides the analysis of variance table. Again, you are most interested in the information that appears at the very bottom of the page, in the section that provides information related to the Type III sum of squares. Under “F Value,” you can see that this analysis resulted in an F statistic of only 0.83, which is quite small. Under “Pr > F,” you can see that the probability value associated with this F statistic is .46. Because this p value is greater than .05, you fail to reject the null hypothesis and, instead, conclude that the type of rewards independent variable did not have a significant effect on rated commitment.
Page 3 of Output 9.2 provides the results of the Tukey HSD test, but you will not interpret these results since the F for the ANOVA was nonsignificant. It is, however, interesting to note that the Tukey test indicates that the three groups were not significantly different from each other. Notice how all three groups are identified by the same letter (“A”).
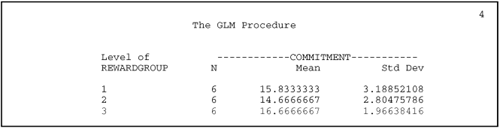
Finally, page 4 of Output 9.2 provides the mean scores on commitment for the three groups. You can see that there is little difference between these means as all three groups display an average score on COMMITMENT between 14 and 17. This is what you would expect with nonsignificant differences. You can use the means from this table to prepare a figure that illustrates the results graphically.
Summarizing the Analysis Results
This section summarizes the present results according to the statistical interpretation format presented earlier. Since the same hypothesis is being tested, however, items A through E would be completed in exactly the same way as before. Therefore, only items F through J are presented here:
F) Obtained statistic: F (2,15) = 0.83.
G) Obtained probability (p) value: p = .46 (nonsignificant).
H) Conclusion regarding the null hypothesis: Fail to reject the null hypothesis.
I) Magnitude of treatment effect: R2 = .10 (small treatment effect).
J) ANOVA summary table:
| Source | df | SS | MS | F | R2 |
|---|---|---|---|---|---|
| Type of rewards | 2 | 12.11 | 6.06 | 0.83 | .10 |
| Within groups | 15 | 109.50 | 7.30 | ||
| Total | 17 | 121.61 | |||
| Note. N = 18. |
K) Figure representing the results:
Figure 9.2. Mean Levels of Commitment Observed for Participants in Low- Reward, Mixed-Reward, and High-Reward Conditions (Nonsignificant Differences Observed)

Formal Description of Results for a Paper
You could summarize the results from the present analysis in the following way for a published paper:
Results were analyzed using a one-way ANOVA, between-subjects design. This analysis failed to reveal a significant effect for type of rewards, F(2, 15) = 0.83, ns with a negligible treatment effect of R2 = .10. The sample means are displayed in Figure 9.2, which shows that the three experimental groups demonstrated similar commitment scores.