
The Chi-Square Test of Independence
When to Use
The chi-square test of independence (sometimes called the chi-square test of association or homogeneity) is appropriate when both variables are assessed on a nominal level of measurement. That is, when both variables are classification variables. Theoretically, either of the variables can have any number of categories, but in practice the number of categories is usually relatively small, perhaps 2 to 10.
The Two-Way Classification Table
The nature of the relationship between two nominal-level variables is easiest to understand using a two-way classification table. This is a table in which the rows represent the categories of one variable, while the columns represent the categories of the second variable. This two-way classification table is important because, once it has been prepared, it is possible to review the number of observations that appear in the various cells of the table to determine if there is any pattern that would indicate some relationship between variables.
For example, assume that you want to prepare a table that plots one variable that contains two categories against a second variable with three categories. The general form for such a table appears in Figure 6.6:
Figure 6.6. General Form for a Two-Way Classification Table

The point at which a row and column intersects is called a cell and each cell is given a unique subscript. The first number in this subscript indicates row to which the cell belongs, and the second number indicates column to which the cell belongs. So the general form for cell subscripts is “cellr by c,” where r = row and c = column. This means that cell21 is at the intersection of row 2 and column 1, cell13 is at the intersection of row 1 and column 3, and so forth. One of the first steps in performing a chi-square test of independence is to determine exactly how many participants fall into each of the cells of the classification table (i.e., how many participants appear in each subgroup). The pattern shown by these subgroups will help you understand whether the two classification variables are related to one another.
An Example
To make this a bit more specific, assume that you are a university administrator preparing to purchase a large number of new personal computers for three of the schools that constitute your university: the School of Arts and Science; the School of Education; and the School of Business. For a given school, you can purchase either IBM compatible computers or Macintosh computers, and you need to know which type of computer the students within each school tend to prefer.
In general terms, your research question is “Is there a relationship between school of enrollment and computer preference?” The chi-square test of independence will help answer this question. If this test shows that there is a relationship between the two variables, you can review the two-way classification table to determine which type of computer most students in each of the three schools prefer.
To answer this question, you draw a representative sample of 370 students from the 8,000 students that constitute the three schools. Each student is given a short questionnaire that asks just two questions:
1. In which school are you enrolled? (Circle one):
a. School of Arts and Sciences.
b. School of Business.
c. School of Education.
2. Which type of computer do you prefer that we
|
These two questions constitute the two nominal-level variables for your study. Question 1 allows you to create a “school of enrollment” variable that can take on one of three values (Arts & Science, Business, or Education), while question 2 allows you to create a “computer preference” variable that can take on one of two values (IBM compatible or Macintosh). Clearly, these are nominal-level variables as they indicate merely group membership and provide no quantitative information.
You can now prepare a two-way classification table that plots preference against school. This table (with fictitious data) appears as Figure 6.7. Notice that in the table, computer preference is the row variable, in that row 1 represents students who preferred IBM compatibles, while row 2 represents those who preferred Macintosh. In the same way, you can see that school of enrollment is the column variable:
Figure 6.7. Two-Way Classification Table Plotting Computer Preference against School of Enrollment
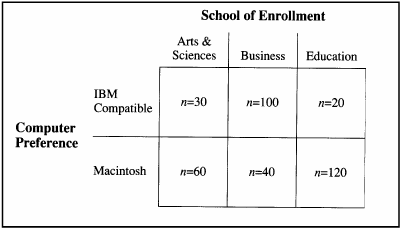
Figure 6.7 presents the number of students who appear in each cell. For example, the first row of the table shows that, among those students who preferred IBM compatibles, 30 were Arts and Science students, 100 were Business students, and 20 were Education majors.
Remember that the purpose of the study is to determine whether there is any relationship between the two variables (i.e., ascertain whether school of enrollment is related to computer preference). This is just another way of saying “if you know what school in which a student is enrolled, does that help you predict what type of computer that student is likely to prefer?” In the present case, this question is easiest to answer if you review the table just one column at a time. For example, review just the Arts and Sciences column of the table. Notice that most of the students (n = 60) preferred Macintosh computers, while fewer (n = 30) preferred IBM compatibles. The column for the Business students shows the opposite trend, however. Most business students (n = 100) preferred IBM compatibles. Finally, the pattern for the Education students was similar to that of the Arts and Sciences students as the majority (n = 120) preferred Macintosh.
In short, there appears to be a relationship between school of enrollment and computer preference, with Business students preferring IBM compatibles, and Arts and Sciences and Education students preferring Macintoshes. At this point, this is just a trend observed in the sample. Is this trend of sufficient magnitude to conclude that the degree of difference is sufficiently larger than might occur by chance alone? To determine this, you conduct the chi-square test of independence.
Tabular versus Raw Data
You can use SAS to compute the chi-square test of independence regardless of whether you are dealing with tabular data or raw data. With raw data, you are working with data that have not been summarized or tabulated in any way. For example, imagine that you administered your questionnaire to 370 students and have not yet tabulated their responses. You merely have 370 completed questionnaires. In this situation, you are working with raw data.
On the other hand, tabular data are summarized in a table. For example, imagine that it was actually another researcher who administered this questionnaire, summarized participant responses in a two-way classification table (similar to Figure 6.7), and provided this completed table in a published report. In this case, you are dealing with tabular data.
When computing the chi-square statistic, there is no real advantage to using one form of data or the other, though you generally have a lot less data to enter if your data are already in tabular form. The following section shows how to input the data and request the chi-square statistic for tabular data. A subsequent section deals with raw data.
Computing Chi-Square from Tabular Data
Inputting Tabular Data
Often, the data to be analyzed with a chi-square test of independence have already been summarized in a two-way classification table such as in Figure 6.7. In these situations, you must create a special type of INPUT statement to read the data. Here is the general form:
DATA   dataset-name;
   INPUT   row-variable-name         $
           column-variable-name      $
           number-variable-name   ;
DATALINES;
row-value   column-value    number-in-cell
row-value   column-value    number-in-cell
row-value   column-value    number-in-cell

...more data...
The INPUT statement in this program tells SAS that the dataset includes three variables. The names of these three variables are symbolized as “row-variable-name,” “column-variable-name,” and “number-variable-name.” The first is a character variable that codes the rows of the classification table (in the present study, the row-variable was “computer preference”). The second variable is a character variable that codes the columns of the table (here, the column-variable was “school of enrollment”). Finally, the third variable (symbolized as “number-variable-name”) is a quantitative variable that codes how many participants appear in a given cell. (You will give specific names to these variables in the program to be presented shortly.)
The preceding program is in free format, meaning that it did not specify in which column in the DATALINES section each variable is located. However, this should not cause problems so long as you remember to separate each value in the DATALINES section by at least one blank space and do not accidentally skip any values in the DATALINES section.
Each line of data in the DATALINES section corresponds to just one of the cells in the classification table. In the preceding general form, the “number-in-cell” in the DATALINES section represents the number of participants in that cell. Therefore, the number of lines in the DATALINES section will be equal to the number of cells in the two-way classification table. The present classification table included six cells, so there will be six data lines in the DATALINES statement.
This is the actual data input step for inputting the tabular data presented in the two-way classification table of Figure 6.7:
 1     DATA D1;
 2        INPUT    PREFERNECE $
 3                 SCHOOL     $
 4                 NUMBER  ;
 5
 6     DATALINES;
 7     IBM   ARTS        30
 8     IBM   BUSINESS   100
 9     IBM   EDUCATION   20
10     MAC   ARTS        60
11     MAC   BUSINESS    40
12     MAC   EDUCATION  120
13     ;
14     RUN;
The preceding INPUT statement tells SAS that the dataset contains just three variables for each line of data. The first variable is a character variable named PREFERENCE (coding student preferences, the row-variable), the second is a character variable named SCHOOL (coding the student’s school, the column-variable), and the third variable is a numeric variable called NUMBER (indicating how many students appear in a given cell). Compare the INPUT statement from the preceding program to the INPUT statement from the general form presented earlier to verify that you understand what each variable name represents.
The DATALINES portion of the program includes six lines of data, one for each cell. The first cell represents those students who preferred IBM compatibles and were in the School of Arts and Sciences. The value for NUMBER on this line shows that there were 30 participants in this cell. The next line shows that there were 100 participants who preferred IBM compatibles and were in the School of Business, and so forth. You should compare the six lines of data to the six cells of Figure 6.6 to verify how the data were coded.
Computing Chi-Square with PROC FREQ Using Tabular Data
By now, you might be wondering why there is so much emphasis on preparing a two-way classification table when you want to perform a chi-square test of independence. This is necessary because computing the chi-square statistic involves determining the observed frequencies in each cell of the table (the number of observations that actually appear in each cell), and comparing these to the expected frequencies in each cell (i.e., the number of observations that you would expect to appear in each cell if the row variable and the column variable were completely unrelated). Now that your two-way classification table has been completed and entered, you can request the chi-square statistic.
Here is the general form for a SAS program that creates a two-way classification table for two nominal-level variables when the data have been entered in tabular form. The options used with these statements (described after the program) allow you to request a chi-square test of independence along with additional information.
PROC FREQ    DATA=dataset-name;
   TABLES   row-variable-name*column-variable-name   /   options ;
   WEIGHT   number-variable-name;
RUN;
These are some of the options for the TABLES statement that can be especially useful in social science research:
ALL
Requests several significance tests (including the chi-square test of independence) and measures of bivariate association. Although several statistics are printed, not all will be appropriate for a given analysis. The choice of the correct statistic will depend on the level of measurement used with the variables along with other considerations.
CHISQ
Requests the chi-square test of independence, and prints a number of measures of bivariate association based on the chi-square statistic.
EXACT
Prints Fisher’s exact test. This is printed automatically for 2 × 2 tables (provided that the CHISQ option is specified), but must be specifically requested for other tables.
EXPECTED
Prints the expected cell frequencies. That is, the cell frequencies that would be expected if the two variables were, in fact, independent or unrelated. This is a very useful option for determining the nature of the relationship between variables.
MEASURES
Requests several measures of bivariate association, along with their asymptotic standard errors. These include the Pearson and Spearman correlation coefficients, gamma, Kendall’s tau-b, Stuart’s tau-c, symmetric lambda, asymmetric lambda, uncertainty coefficients, as well as other measures. Again, some of these indices will not be appropriate for a given study. All of these measures are printed if you request the ALL option.
To illustrate, here is a complete SAS program that reads tabular data, creates a two-way classification table, and prints the statistics requested by the ALL option (including the chi-square statistic):
 1     DATA D1;
 2        INPUT   PREFERENCE  $
 3                SCHOOL      $
 4                NUMBER   ;
 5
 6     DATALINES;
 7     IBM   ARTS        30
 8     IBM   BUSINESS   100
 9     IBM   EDUCATION   20
10     MAC   ARTS        60
11     MAC   BUSINESS    40
12     MAC   EDUCATION  120
13     ;
14     RUN;
15
16     PROC FREQ   DATA=D1;
17        TABLES   PREFERENCE*SCHOOL   /   ALL;
18        WEIGHT   NUMBER;
19     RUN;
The preceding TABLES statement requests that PREFERENCE be the row-variable and SCHOOL be the column-variable in the printed table. This request is followed by a slash (/), the ALL option, and a semicolon.
In the WEIGHT statement, you provide the name of the variable that codes the number of participants in each cell. In this case, you specify the variable NUMBER.
The two-way classification table produced by this program appears here as Output 6.7:
Output 6.7. Two-Way Classification Table Requested by PROC FREQ
          Table of PREFERENCE by SCHOOL

PREFERENCE      SCHOOL

Frequency|
Percent  |
Row Pct  |
Col Pct  |ARTS    |BUSINESS|EDUCATIO|  Total
---------+--------+--------+--------+
IBM      |     30 |    100 |     20 |    150
         |   8.11 |  27.03 |   5.41 |  40.54
         |  20.00 |  66.67 |  13.33 |
         |  33.33 |  71.43 |  14.29 |
---------+--------+--------+--------+
MAC      |     60 |     40 |    120 |    220
         |  16.22 |  10.81 |  32.43 |  59.46
         |  27.27 |  18.18 |  54.55 |
         |  66.67 |  28.57 |  85.71 |
---------+--------+--------+--------+
Total          90      140      140      370
24.32 37.84 37.84 100.00 |
In the 2 × 3 classification table reproduced in Output 6.7, the name of the row variable (PREFERENCE) appears in the upper-left corner. The label for each row appears on the far-left side of the appropriate row. The first row (labeled IBM) represents the participants who preferred IBM compatibles and the second row (labeled MAC) represents participants who preferred Macintoshes.
The name of the column-variable (SCHOOL) appears above the three columns and each, in turn, is headed with its label. Column 1 represents the Arts and Sciences students, column 2 represents the Business students, and column 3 represents the Education students.
Where a given row and column intersect, information regarding participants in that cell is provided. Within each cell, the following information is provided (in this sequence):
The “Frequency” or the raw number of participants in the cell.
The “Percent” or the percent of participants in that cell relative to the total number of participants (the number of participants in the cell divided by the total number of participants).
The “Row Pct” or the percent of participants in that cell, relative to the number of participants in that row. For example, there are 30 participants in the IBM ARTS cell, and 150 participants in the IBM row. Therefore, the row percent for this cell is 30 / 150 = 20%.
The “Col Pct” or the percent of participants in that cell, relative to the number of participants in that column. For example, there are 30 participants in the IBM ARTS cell, and 90 participants in the ARTS column. Therefore, the column percent for this cell is 30 / 90 = 33.33%.
In the present example, it is particularly revealing to review the classification table just one column at a time and to pay particular attention to the last entry in each cell: the “column percent.” First, consider the ARTS column. The column percent entries show that only 33.33% of the Arts and Sciences students preferred IBM compatibles whereas 66.67% preferred Macintoshes. Next, consider the BUSINESS column that shows the reverse trend: 71.43% of the Business students preferred IBM compatibles while only 28.57% preferred Macintoshes. Finally, the trend of the Education students in the EDUCATION column is similar to that for the Arts and Sciences students: only 14.29% preferred IBM compatibles while 85.71% preferred Macintoshes.
These percentages reinforce the suspicion that there is a relationship between school of enrollment and computer preference. But is the relationship statistically significant (i.e., can these differences occur by chance alone)? To answer this, you must consult the chi-square test of independence, which (along with other information) is reproduced in Output 6.8.
Output 6.8. Chi-Square Test of Independence and Other Statistics Requested by the ALL Option
Statistics for Table of PREFERENCE by SCHOOL Statistic DF Value Prob ------------------------------------------------------- Chi-Square 2 97.3853 <.0001 Likelihood Ratio Chi-Square 2 102.6849 <.0001 Mantel-Haenszel Chi-Square 1 16.9812 <.0001 Phi Coefficient 0.5130 Contingency Coefficient 0.4565 Cramer's V 0.5130 |
The chi-square test of independence is the first statistic in the table. It tests the null hypothesis that, in the population, the two variables are independent, or unrelated. When the null hypothesis is true, expect the value of the chi-square statistic to be relatively small. The stronger the relationship between the two variables in the sample, the larger the chi-square statistic will be.
Output 6.8 shows that the obtained chi-square value was approximately 97.39, with 2 degrees of freedom. The degrees of freedom for the chi-square test are calculated as:
df = (r-1)(c-1)
where:
r =  number of categories for the row variable and;
c =  number of categories for the column variable.
For the current analysis, the row variable (PREFERENCE) had two categories and column variable (SCHOOL) had three categories, so the degrees of freedom are calculated as:
df = (2-1)(3-1)
   = (1)(2)
   = 2
At 97.39, the obtained value of the chi-square statistic is quite large, given the degrees of freedom. The probability, or p value, for this chi-square statistic is printed below the heading “Prob” in Output 6.8. This p value is less than .01, meaning that there is less than one chance in 100 of obtaining a chi-square value of this size (or larger) by chance alone. You can therefore reject the null hypothesis and tentatively conclude that school of enrollment is related to computer preferences.
Computing Chi-Square from Raw Data
Inputting Raw Data
If data to be analyzed are in raw form (i.e., if the data have not already been summarized in a two-way classification table), you can enter them following the procedures discussed in Chapter 3. For example, if the preceding questionnaire had been administered to the 370 participants, you could enter their data according to the following guide:
| Column | Variable Name | Explanation |
|---|---|---|
| 1-4 | SCHOOL | School of enrollment, coded:
|
| 5 | blank | |
| 6-8 | PREFERENCE | Computer preference, coded:
|
The entire data input step, including a small portion of the sample data, is presented here:
 1     DATA D1;
 2        INPUT   #1   @1   SCHOOL      $4.
 3                     @6   PREFERENCE  $3.   ;
 4     DATALINES;
 5     ARTS       IBM
 6     BUSINESS   IBM
 7     BUSINESS   MAC
 8     EDUCATION  IBM
 9     .
10     .
11     .
12     EDUCATION  MAC
13     ARTS       MAC
14     BUSINESS   IBM
15     ;
16     RUN;
The fictitious data for the participants begin on line 5, and there is one line of data for each. You can see that the first participant was an Arts and Sciences student and preferred an IBM compatible, the second student was a Business student and also preferred an IBM compatible, and so forth. For this program, there are 370 lines of data because there are 370 participants.
The preceding program specified SCHOOL and PREFERENCE as character variables with values such as ARTS and MAC, but it also would have been possible to code them as numeric variables. For example, SCHOOL could have been coded so that 1 = Arts and Sciences, 2 = Business, and 3 = Education. You could have proceeded with the analysis in the usual fashion though you would then have to make a record to remember exactly which group is represented by these numerical values, or use the VALUES statement of PROC FORMAT to attach meaningful value labels (e.g., “ARTS” and “BUSINESS”) to the variable categories when they are printed. For the latter approach, see SAS/STAT User’s Guide.
Computing Chi-Square with PROC FREQ Using Raw Data
Here is the general form of the statements that request a chi-square test of independence (along with other statistics) when the data are input in raw form:
PROC FREQ   DATA=dataset-name;
   TABLES   row-variable*column-variable   /   options ;
RUN;
This general form is identical to the general form used with tabular data except that the WEIGHT statement is deleted. The full program (including a portion of the data) to compute the chi-square test with raw data is presented here:
 1     DATA D1;
 2        INPUT   #1   @1   SCHOOL      $4.
 3                     @6   PREFERENCE  $3.    ;
 4     DATALINES;
 5     ARTS       IBM
 6     BUSINESS   IBM
 7     BUSINESS   MAC
 8     EDUCATION  IBM
 9     .
10     .
11     .
12     EDUCATION  MAC
13     ARTS       MAC
14     BUSINESS   IBM
15     ;
16     RUN;
17
18     PROC FREQ   DATA=D1;
19        TABLES   PREFERENCE*SCHOOL   /    ALL;
20     RUN;
From this point forward, the analysis proceeds in exactly the same manner as when the dataset was based on tabular data. You can request the same options, and you interpret the results in exactly the same way.
Special Notes Regarding the Chi-Square Test
Using Fisher’s Exact Test for 2 × 2 Tables and Larger Tables
A 2 × 2 table contains just two rows and two columns. A two-way classification table for a chi-square study will be a 2 × 2 table if there are just two values for the row-variable and just two values for the column-variable. Imagine that you modified the preceding computer preference study so that there were just two values for the computer preference variable (i.e., IBM compatible and Macintosh) as before, but just two values for the school of enrollment variable (i.e., Arts and Sciences and Business). The two-way classification table that would result from this modified study would resemble the one portrayed in Figure 6.7 except that the column for the School of Education would be eliminated. The resulting table is called a 2 × 2 table because it consists of just two rows (IBM versus Macintosh) and two columns (Arts & Sciences versus Business).
When analyzing a 2 × 2 classification table, it is best to use Fisher’s exact test rather than the standard chi-square test of independence. This test is printed automatically whenever a 2 × 2 table is analyzed and you request the FISHER option. In the SAS output, examine the probability value that appears to the right of the heading “Fisher’s Exact Test.” This estimates the probability of observing a table that gives at least as much evidence of association as the one actually observed, given that the null hypothesis is true. (See the SAS/STAT User’s Guide for more information.) In other words, when the significance level for Fisher’s exact test is less than .05, you can reject the null hypothesis that the two nominal-scale variables are independent in the population, and can conclude that they are, in fact, related.
In some situations, Fisher’s exact test can also be appropriate for larger classification tables (i.e., for tables with more than two rows and/or columns). This is the case when the sample size is small and the sample size per degree of freedom is less than 5. With larger classification tables, you must specifically request the Fisher’s exact test by specifying the EXACT option in the TABLES statement. See the SAS/STAT User’s Guide for further details.
Minimum Cell Frequencies
The chi-square test might not be valid if the observed frequency in any of the cells is zero or if the expected frequency in any of the cells is less than five (use the EXPECTED option with the TABLES statement to compute expected cell frequencies). When these minimums are not met, consider gathering additional data or perhaps collapsing similar categories in order to increase cell frequencies.