
Chapter 24
Finding repetitions in biological networks: challenges, trends, and applications
24.1 Introduction
For many years, analysis of biological sequences (also termed biosequences) associated with proteins and genomes played a key role in understanding the mechanisms inside the cell [7, 47, 49]. After the genome coding of several organisms was completed [13], significant attention began to focus on studying how cellular components interact with each other to accomplish the biological functions of the cell [59].
While biosequences are usually represented by strings defined on a finite alphabet, where symbols are associated with amino acids or nucleotides, interaction data can be instead modeled by graphs, called biological networks, where nodes represent components and edges their interactions. The set of all the protein–protein interactions (PPIs) of a specific organism represents its interactome.
Despite the different models adopted to analyze biological data, there is a common peculiarity characterizing them; this is termed their intrinsic repetitiveness. The presence of repetitions can be considered biologically interesting in many cases, for example, when the presence of repeted elements is discovered among cells belonging to different organisms, or if a specific feature appears several times in the same cell. Often suitable statistical indices can be usefully exploited in order to characterize the significativeness of the repetitions found [51].
Searching for common substrings in a set of biosequences can help classify them and predict their biological function [36]. On the other hand, the presence of repeated modules across biological networks was also shown to be very relevant. Indeed, several studies proved that biological networks can often be understood in terms of coalitions of basic repeated building blocks [40, 44]. Discovering similar subnetworks in the interactome of different organisms is useful in revealing complex mechanisms at the basis of evolutionary conservations, and to infer the biological meaning of groups of interacting cellular components, possibly belonging to organisms not yet wellcharacterized [53].
The problem of finding interesting repetitions in biological data can be formulated according to different perspectives. In general, if ![]() is a suitable data structure storing the specific biological data under consideration (e.g., a string or a graph), we can distinguish the following three main classes of problems:
is a suitable data structure storing the specific biological data under consideration (e.g., a string or a graph), we can distinguish the following three main classes of problems:
In both the second and the third formulations of the problem, instead of considering as a gauge of interestingness the frequency of repetitions, other statistical evaluations, such as expectation or ![]() score, can be suitably exploited as well.
score, can be suitably exploited as well.
From sequences to networks, the difficulty in solving the problems listed above increases. While most exact algorithms searching for repetitions in biosequences need polynomial time (despite the number of repetitions that can be generated), the case of biological networks is much more complicated, often involving subgraph isomorphism checking, which is known to be NP-complete [27]. Therefore, using exact algorithms to search for repetitions in biological networks is seldom feasible, except in a few cases, for which fixed-parameter tractability (FPT) algorithms were designed [e.g., 6,15]. However, such exact approaches are suitable only for specific contexts, where the most general techniques are based on approximate and heuristic approaches [e.g., 38,56].
The main goal of this chapter is to analyze how the general problem of finding repetitions in biological data evolved from sequences to networks data, by focusing on the open challenges and specific applications in biological networks.
In particular, we first recall some basic notions about the domain under consideration, that is, biological networks (Section 24.2). Then, in Section 24.3, we describe in detail how the three problem formulations listed above can be specialized in both the biological sequence and network domains, and we also provide an overview of the main applications in biological networks (Section 24.4). Finally, in Section 24.5 we draw our conclusive remarks.
24.2 The Biological Networks Domain
Since the 1990s, both high-throughput experimental techniques [28, 34] and computational methods [43, 59] have contributed to collection of cellular component interactions, stored in public databases [e.g., 8,30,42]. To model such biological information, suitable networks where interacting components are linked together have been exploited.
Three main types of biological networks have been studied in the literature: protein–protein interaction (PPI) networks, metabolic networks, and gene regulatory networks. All these networks may be represented as graphs ![]() , where
, where ![]() is a set of nodes and
is a set of nodes and ![]() is a set of (directed/indirect) edges.
is a set of (directed/indirect) edges.
In the following sections, we briefly recall the main characteristics of each kind of biological network.
24.2.1 Protein–Protein Interaction Networks
Proteins are the basic constituents of living beings. It has been shown that studying how proteins interact inside the cell is necessary to understanding the biological processes in which they are involved [59]. Many PPIs have been discovered in the last years [28, 34, 43].
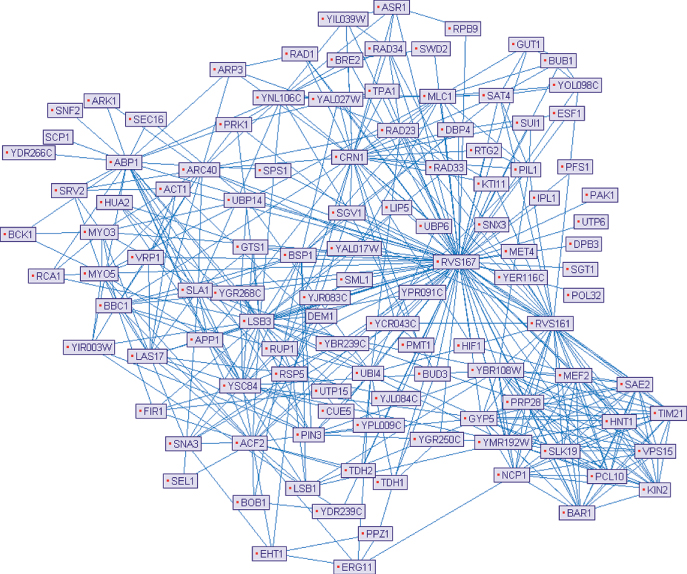
The set of all the PPIs of a given organism is its interactome, usually modeled by an indirect graph, called a protein–protein interaction network (PPI network), where nodes represent involved proteins and edges encode their interactions. Figure 24.1 illustrates such a representation for a small portion of the Saccharomyces cerevisiae interactome.
Figure 24.1 A small portion of the Saccharomyces cerevisiae interactome, drawn by using PIVOT [45].
Often, a PPI network is represented by its adjacency matrix, that is, a binary matrix ![]() where both rows and columns are associated with the proteins in the network, such that
where both rows and columns are associated with the proteins in the network, such that ![]() if protein
if protein ![]() interacts with protein
interacts with protein ![]() , and
, and ![]() otherwise.
otherwise.
24.2.2 Metabolic Networks
Metabolic networks model the whole set of metabolic and physical processes on the basis of the physiological and biochemical properties of the cell, such as the chemical reactions of metabolisms and the corresponding regulatory interactions. Metabolic networks are often employed to simulate and understand the molecular mechanisms that regulate the organisms, often correlating the genome with aspects of molecular physiology [25, 58].
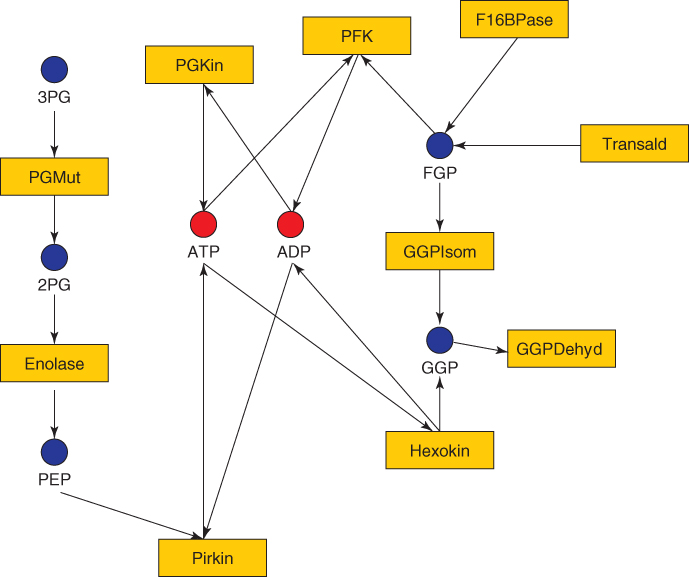
A metabolic network is often modeled by a bipartite graph, where the two types of nodes represent, respectively, reactions and chemical compounds (see Fig. 24.2). Alternatively, a metabolic network can be represented by a compound graph, that is, a compact version of the bipartite graph where only compound vertices are retained and information on the reactions is stored as edge labels. The reaction graph is the symmetric representation of a compound graph (i.e., reaction vertices are retained and information on the compounds is stored as edge labels). When directed versions of these graphs are considered, the direct edges express the reversibility/irreversibility of some reactions.
Figure 24.2 An example of a metabolic network.
24.2.3 Gene Regulatory Networks
Gene regulatory networks denote the genes expressed in the cell in response to biological signals. Gene regulatory networks are also called transcription regulation networks, since they describe the interactions between transcription factor proteins and the genes that they regulate [9, 37]. Transcription factors respond to biological signals and accordingly change the transcription rate of genes, allowing cells to produce the proteins they need at the appropriate times and amounts [41].
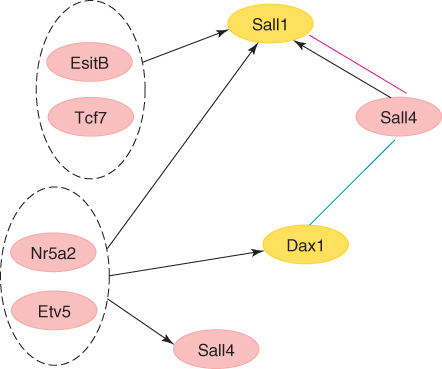
A gene regulatory network can be represented as a directed graph, in which nodes represent proteins, their corresponding mRNAs, and protein–protein complexes (see Fig. 24.3). In particular, the nodes of a gene regulatory network are also associated with genes, by referring to the DNA sequences that are transcribed into the mRNAs that translate into proteins. Edges between nodes represent individual molecular reactions, the protein–protein and protein–mRNA interactions through which the products of one gene affect those of another one. When interactions are inductive (i.e., meaning that an increase in the concentration of one component leads to an increase in the other one), they are represented by arrowheads; when interactions are inhibitory (i.e., when an increase in one component leads to a decrease in the other one), then they are represented by filled circles. A series of edges indicates a chain of such dependences, with cycles corresponding to feedback loops.
Figure 24.3 A small portion of the gene regulatory network in mouse embryonic stem cells [63].
A gene regulatory network may also be represented as a connectivity matrix ![]() , such that
, such that ![]() if the component associated with node
if the component associated with node ![]() encodes a transcription factor regulating the component associated to node
encodes a transcription factor regulating the component associated to node ![]() , and
, and ![]() otherwise.
otherwise.
24.3 Problem Formulation
We now consider some technical details concerning the problem of searching for repetitions in biological data.
Let ![]() be a complex structure (e.g., a string or a graph) containing basic elements (e.g., characters or nodes). We suppose that all the basic elements in
be a complex structure (e.g., a string or a graph) containing basic elements (e.g., characters or nodes). We suppose that all the basic elements in ![]() can be represented as suitable symbols. Let
can be represented as suitable symbols. Let ![]() be the finite alphabet containing all such symbols. The following definition is important to understand when substructures of the same kind of
be the finite alphabet containing all such symbols. The following definition is important to understand when substructures of the same kind of ![]() are repeated in
are repeated in ![]() , or in a set of structures like
, or in a set of structures like ![]() .
.
![]()
where ![]() is a suitable threshold value fixed a priori.
is a suitable threshold value fixed a priori.
In the biosequences domain, suitable distances that can be adopted are for example the Hamming and the Levenshtein distances. When ![]() is a graph modeling a biological network, the concept of distance is less immediately defined. Indeed, the concept of similarity between subgraphs is always to be related to the subgraph isomorphism check, which is a difficult task, as mentioned earlier [27]. Furthermore, several distinct aspects can be taken into account, for example, the focus can be on the similarity between nodes, rather than between edges and structures, according to the specific biological problem under consideration.
is a graph modeling a biological network, the concept of distance is less immediately defined. Indeed, the concept of similarity between subgraphs is always to be related to the subgraph isomorphism check, which is a difficult task, as mentioned earlier [27]. Furthermore, several distinct aspects can be taken into account, for example, the focus can be on the similarity between nodes, rather than between edges and structures, according to the specific biological problem under consideration.
Accordingly, different formulations of the problem of finding repetitions in biological data can be provided.
In biosequences analysis, Formulation 24.1 is the analog of string pattern matching, where approximate occurrences can be handled by allowing wildcards and/or gaps [26]. As an example, let ![]() be a string
be a string ![]()
![]() defined on the finite alphabet
defined on the finite alphabet ![]() and let
and let ![]() be the string
be the string ![]() , defined on
, defined on ![]() . If
. If ![]() and the Hamming distance is considered, it is easy to see that
and the Hamming distance is considered, it is easy to see that ![]() has three occurrences in
has three occurrences in ![]() , thus matching
, thus matching ![]() in
in ![]() the output result set is
the output result set is ![]() .
.
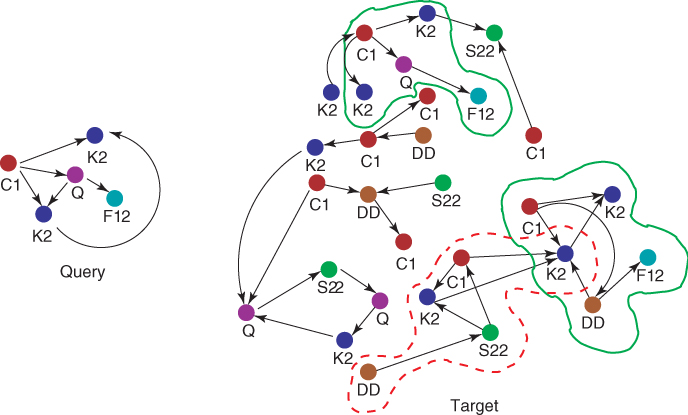
In biological networks analysis, matching a query consists in analyzing an input network, called the target network, searching for possible subnetworks that are similar to a query subnetwork of interest. Such a problem, also known as network querying [20, 62], “is aimed at transferring biological knowledge within and across species” [53]. The so-found subnetworks may indeed correspond to cellular components involved in the same biological processes or performing similar functions than components in the query.
When approximate occurrences are searched for, mismatches possibly including both node/edge insertions and deletions can be allowed as well. The following example clarifies how Formulation 24.1 can be applied to biological networks.
Formulation 24.2 is related to the concept of motif, which has been exploited in different applications of computational biology [3, 47]. Depending on the context, what is a motif may assume sensibly different meanings. In general, motifs are always associated to repetitive objects. For example, a repeated substring can be considered a motif when its frequency is greater than a fixed threshold, or instead when it is much different from that expected [2].
Also in the context of biological networks, a motif can be defined according to its frequency or to its statistical significance [12]. In the first case, a motif is a subgraph that appears more often than a given threshold number of times in an input network; in the second case, a motif is a subgraph that appears more (or less) often than expected. In particular, to measure the statistical significance of the motifs, many works compare the number of appearances of the motifs in the biological network with the number of appearances in a number of randomized networks [17], by exploiting suitable statistical indices such as the p value or the z score [44].
Despite the similarity with sequences, network motifs present important differences with respect to string motifs, the main important of which concerns the computational complexity of the problem of motif extraction, which is polynomial for strings and exponential (in the size of the input structure) for networks.
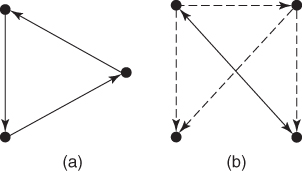
Figure 24.5 shows two of the most frequent network motifs, called brick and feedforward loop, respectively.
Figure 24.5 (a) Brick; (b) feedforward loop.
As is Formulation 24.2, Formulation 24.3 is also related to the concept of motif. However, in this case the repetitions to be searched for occur in different structures, rather than in a single one.
Searching for common substrings repeated in a set of biosequences can be useful for classifying them. For example, if there are ![]() amino acid sequences and
amino acid sequences and ![]() of them present one or several similar subsequences, the corresponding proteins most likely belong to the same protein family. In sequence analysis, alignment is often performed to arrange the biosequences in such a way as to identify regions of similarity that may be a consequence of functional, structural, or evolutionary relationships between them. The so-aligned biosequences are usually represented as rows within a matrix. Gaps may also be inserted between the characters, so that identical or similar characters are aligned in successive columns and individuating common subsequences is then simpler.
of them present one or several similar subsequences, the corresponding proteins most likely belong to the same protein family. In sequence analysis, alignment is often performed to arrange the biosequences in such a way as to identify regions of similarity that may be a consequence of functional, structural, or evolutionary relationships between them. The so-aligned biosequences are usually represented as rows within a matrix. Gaps may also be inserted between the characters, so that identical or similar characters are aligned in successive columns and individuating common subsequences is then simpler.
When biological networks are considered, discovering repetitions in multiple structures consists in finding a set of conserved edges across the input networks, that is, a set of conserved subgraphs.
For both sequences and networks Formulation 24.3 can be performed by aligning pairs of structures (sequences or networks) or more than two structures at a time. Multiple alignments are often useful to individuate evolutionary conservations, but they are computationally difficult to produce. Furthermore, two different cases can be distinguished:
24.3.1 Global Alignment
Global sequence alignment consists in aligning every character in every input sequence, and it is useful when the sequences in the query set are similar and of roughly equal size.
Global network alignment aims at finding a unique (possibly the best one) overall alignment between the input networks, in such a way that all the nodes of the networks are mapped.
Global sequence alignment is often used to compare genomic sequences to understand variations between species. Analogously, global network alignment may be used, for example, to compare interactomes and to understand cross-species variations. In contrast to global sequence alignment, global network alignment may also be useful when the input networks have significantly different sizes.
In greater detail, the output of global network alignment is a set of tuples ![]()
![]() where each
where each ![]() is a subgraph of one of the input networks that is similar to the other subgraphs in the same tuple. In terms of repetition, we can see such a tuple as the set of occurrences of the same motif, occurring in
is a subgraph of one of the input networks that is similar to the other subgraphs in the same tuple. In terms of repetition, we can see such a tuple as the set of occurrences of the same motif, occurring in ![]() of the input networks. The peculiarity of global alignment as opposed to the local one is that each
of the input networks. The peculiarity of global alignment as opposed to the local one is that each ![]() cannot share common nodes with any other
cannot share common nodes with any other ![]() of the same input network that is involved in a different output tuple.
of the same input network that is involved in a different output tuple.
24.3.2 Local Alignment
Local sequence alignment aims at identifying regions of similarity within long sequences that are often widely divergent overall. Local sequence alignment is useful to analyzing dissimilar sequences, for which are suspected to contain regions of similarity or similar sequence motifs within their larger sequence context.
Local network alignment instead consists in finding similar motifs between two or several networks, and the mappings corresponding to different motifs may also be mutually inconsistent. The objective is to find multiple unrelated regions of isomorphism among the input networks, with each region implying a mapping independently of the others. Local network alignment may be applied, for example, to search for a known functional component (e.g., pathways, complexes) in a new species.
The output of local network alignment is, again, a set of tuples ![]()
![]() , similar to the case of global network alignment. However, in this case, each
, similar to the case of global network alignment. However, in this case, each ![]() can share common nodes with some other
can share common nodes with some other ![]() of the same input network, involved in a different output tuple.
of the same input network, involved in a different output tuple.
24.4 Methods
In this section we summarize the more recent applications for each formulations presented in the previous section with respect to the problem of searching repetitions in biological networks.
24.4.1 Matching a Query
Many approaches presented in the literature that aim at searching for small query subnetworks repeated in a target network focus on queries that are not general graphs, but paths or trees. As an example, Kelley et al. proposed PathBLAST [31], an approach to align two PPI networks by combining interaction topology and protein sequence similarity in order to identify conserved interaction pathways and complexes. Their algorithm searches for high-scoring pathway alignments involving two paths, one for each network, in which proteins of the first path are paired with putative homologs occurring in the same order in the second path. This is achieved by generating a network alignment graph where each node consists of a pair of sequence-similar proteins, each belonging to a different species; thus, links between pairs of nodes may be associated with conserved protein interactions between the corresponding proteins. As a byproduct, the authors use PathBLAST also for network querying by designating one of the two networks in input as the query for the other one.
Pinter et al. [48] proposed MetaPathwayHunter, an algorithm to query metabolic networks, where the queries are multisource trees. In particular, these query trees are directed acyclic graphs for which the correspondent undirected graphs are trees such that some of the nodes may present both incoming and outgoing edges. MetaPathwayHunter searches the networks for approximated matching, allowing node insertions (only one node), whereas no deletions are allowed.
QPath and QNet were proposed by Shlomi et al. [55] and Dost et al. [15], respectively. QPath queries a PPI network by a query pathway consisting of a linear chain of interacting proteins belonging to another organism. The algorithm works similarly to sequence alignment, by aligning the query pathway to putative pathways in the target network, so that proteins in analogous positions have similar sequences. PPI networks interactions reliability scores are considered, and insertions and deletions are allowed. QNet is an extension of QPath in which the queries are trees or graphs with limited treewidth.
GenoLink [16] is a system able to integrate data from different sources (e.g., databases of proteins, genes, organisms, chromosomes) and to query the resulting data graph by graph patterns with constraints attached to both vertices and edges; a query result is the set of all the subgraphs of the target graph that are sufficiently similar to the query pattern and satisfy the constraints.
Yang and Sze [60] considered the two problems of path matching andgraph matching. In particular, they present an exact algorithm to search for subgraphs of arbitrary structure in large graph, grouping related vertices in the target network for each vertex in the query. Although their algorithm is accurate and also efficient enough to be considered exact, the authors state that it is practical for queries having ![]() nodes, and its performance improves if the query is a sparse graph.
nodes, and its performance improves if the query is a sparse graph.
Ferro et al. [19] present an approach called NetMatch, a Cytoscape plugin for the network querying allowing for an approximated query, such that certain parts of the subgraph query may be left unspecified. A query for NetMatch is a graph in which some nodes are specified and others are wildcards (which can match an unspecified number of elements). Ferro et al. [19] focus mainly on the topological similarity between the query and target graphs, without taking into account information about node similarities.
Fionda et al. [21] modeled PPI networks through labeled graphs in order to factor in the reliability of interactions, allowing for a more accurate analysis, and a proposed a technique is based on maximum-weight matching of bipartite graphs.
Rombo et al. [50] present an efficient framework based on hidden Markov models that can be used for finding homologous pathways in a network of interest. Given a query path, the method identifies the top ![]() matching paths in the network, which may contain any number of consecutive insertions and deletions. The authors apply their method on PPI networks.
matching paths in the network, which may contain any number of consecutive insertions and deletions. The authors apply their method on PPI networks.
Blin et al. [6] propose an algorithm for matching a query in the shape of graphs, based on dynamic programming and the color coding technique. To transform graphs queries into trees without loss of information, they use a feedback vertex set coupled to a node duplication mechanism. The resulting algorithm is FPT for querying graphs with a bounded size of their feedback vertex set, by giving an alternative to the treewidth parameter, which can be better or worse for a given query. The approach has been successfully applied to retrieve human query networks in the shape of graphs into the fly PPI network.
Ferraro et al. [18] propose AbiNet, an approach for aligning and querying biological networks according to an asymmetric comparison, allowing utilization of differences in the characterization of organisms. They exploit finite automatons suitably coupled with the Viterbi algorithm and use the best characterized organism (master) as a fingerprint to guide the alignment process to the second input network (slave). AbiNet allows for two different uses of the network querying mode: set the network query as the master and the target one as the slave, if attention is focused on finding the pairwise interactions of a specific module (the query) that are conserved in a specific organism (the target). The opposite master/slave arrangement is appropriate when, instead, the objective is to individuate possible diversifications of a module in a more complex target organism.
24.4.2 Discovering Repetitions in a Single Structure
The search of significant repetitions in a single biological network was pioneered by Shen-Orr et al. [54], who defined network motifs as “patterns of interconnections that recur in many different parts of a network at frequencies much higher than those found in randomized networks.” They [54] studied the transcriptional regulation network of Escherichia coli, by searching for small motifs composed by three or four nodes. In particular, three highly significant motifs characterizing such network have been discovered; the most famous is the feedforward loop, shown in Figure 24.5b, whose importance has been shown in further studies [39, 40].
The technique presented by Shen-Orr et al. [54] laid the foundations for different extensions, mainly of three proposed in 2004 and 2008 [5, 10, 61].
Yeger-Lotem et al. [61] identified composite motifs consisting of two kinds of interaction by exploiting edges of different colors in the network modeling. The authors identified an integrated cellular interaction network by two types (colors) of edges, representing protein–protein and transcription–regulation interactions, and developed algorithms for detecting network motifs in such networks with multiple types of edges. Such a study may be considered as a basic framework for detecting the building blocks of networks with multiple types of interaction.
In another study [5], topological motifs derived from families of mutually similar, but not necessarily identical, patterns were discussed and extracted from the gene regulatory network of E. coli. The authors developed a search algorithm to extract topological motifs called graph alignment, in analogy to sequence alignment, that is based on a scoring function. They observed that, in biological networks, functionally related motifs do not need to be topologically identical; thus, they discussed motifs derived from families of mutually similar but not necessarily identical patterns.
In yet another study [10], ![]() -node “bridge” and “brick” motifs were searched for in complex networks, and the presence of such motifs was associated with network topology, but not with network size. The authors proposed a method for performing simultaneously the detection of global statistical features and local connection structures, and the location of functionally and statistically significant network motifs.
-node “bridge” and “brick” motifs were searched for in complex networks, and the presence of such motifs was associated with network topology, but not with network size. The authors proposed a method for performing simultaneously the detection of global statistical features and local connection structures, and the location of functionally and statistically significant network motifs.
All these approaches [5, 10, 54, 61] relate the concept of motif only to network topology, without considering possible properties shared by network nodes in terms of their mutual similarity. According to such a definition of motifs, subgraphs containing the same number of nodes and presenting similar topology may be recognized as motifs, although their nodes are associated with components presenting significant differences (e.g., proteins with very low sequence homology).
Lacroix et al. [35], observed biological networks (e.g., metabolic networks) where a purely topological definition of motifs seems to be inappropriate,as similar topologies can give rise to very different functions. Thus, they [35] introduce a new definition of motifs in the context of metabolic networks, such that the components of the network play a central role and the topology can be added only as a further constraint.
Similarly to the Lacroix et al. study [35], Parida [46] related the concept of motif is to both graph structure and node similarity. In particular, the author presents a three-step exact approach based on the application of the notion of maximality, used extensively in strings, to graphs.
Both works [35, 46] open the way for definition of new, exact, or approximate, approaches for motif extraction, taking into account not only the network topology but also the biological properties of the interacting components.
24.4.3 Discovering Repetitions in Multiple Structures
We consider at first the case of global network alignment, which was proposed for the first time by Singh et al. [56]. In particular, the authors present IsoRank, an algorithm for pairwise global alignment of PPI networks working in two stages: (1) associating a score with each possible match between nodes of the two networks, and then (2) constructing the mapping for the global network alignment by extracting mutually consistent matches according to a bipartite graph weighted matching performed on the two entire networks. IsoRank was extended in Singh's later paper [57], where a multiple alignment among five PPI networks is illustrated. To this aim, the authors exploited an approximate multipartite graph weighted matching.
Liao et al. [38] proposed the IsoRankN (IsoRank-Nibble) tool, which is a global multinetwork alignment tool based on spectral clustering on the induced graph of pairwise alignment scores. As it is based on spectral methods, IsoRankN is both error-tolerant and computationally efficient.
A graph-based maximum structural matching formulation for pairwise global network alignment was introduced [32]. On the basis of such formulation, an approach exploiting the Lagrangian relaxation technique combined with a branch-and-bound method to perform global network alignment is proposed.
In another paper [11] the algorithm PISwap is presented for computing global pairwise alignments of protein interaction networks. The approach is based on a local optimization heuristic that has previously demonstrated its effectiveness for a variety of other NP-hard problems, such as the traveling salesperson problem (TSP). PISwap begins with a sequence-based network alignment and then iteratively adjusts the alignment by incorporating network structure information.
The already discussed AbiNet [18] performs an asymmetric global alignment on pairs of biological networks. It is able to return biologically meaningful associations that a symmetric approach (such as IsoRank) does not find, as shown by an experimental campaign performed on yeast, fly, humans, and two bacteria.
Local network alignment was pioneered by Kelley et al. [31] with Pathblast, whose main characteristics were described in Section 24.4.1. Pathblast has been extended [52] for comparison with several PPI networks. In particular, such an extension is based on the generation of a network alignment graph where each node consists of a group of sequence-similar proteins, one for each species, and each link between a pair of nodes represents a conserved protein interaction between the corresponding protein groups.
In another study [33], a pair of PPI networks are considered as input and a technique using duplication/divergence models through definition of duplications, matches, and mismatches in a graph-theoretic framework is presented. In particular, the alignment problem is reduced to a graph optimization problem, and efficient heuristics are proposed to solve this problem.
Bandyopadhyay et al. [4] proposed a strategy to identify functionally related proteins supplementing sequence-based comparisons with information on conserved protein–protein interactions. The technique first aligns two PPI networks using only sequence similarities, and then performs probabilistic inference (based on Gibbs sampling) to identify pairs of proteins that are likely to retain the same function. The approach has been specifically applied to resolve ambiguous functional orthology relationships in PPI networks.
Functional orthology detection was been considered in another study [23], where Bi-GRAPPIN, a method based on maximum-weight matching of bipartite graphs, is presented. In particular, the bipartite graphs result from comparing the adjacent nodes of pairs of proteins occurring in the input networks. The basic idea is that proteins belonging to different networks should be matched in terms of not only their own sequence similarity but also the similarity of proteins with which they significantly interact with. Bi-GRAPPIN has been exploited [22] as a preliminary step in applying a node collapsing–based technique to extract similar subgraphs from two input networks.
Flannick et al. [24] presented an algorithm for multiple network alignment, named Graemlin. Graemlin aligns an arbitrary number of networks to individuate conserved functional modules, greedily assigning the aligned proteins to nonoverlapping homology classes and progressively aligning multiple input networks. The algorithm also allows searching for different conserved topologies defined by the user. It can be used either to generate an exhaustive list of conserved modules in a set of networks (network-to-network alignment) or to find matches to a particular module within a database of interaction networks (query-to-network alignment).
In another study [14] the algorithm C3Part-M, based on a nonheuristic approach exploiting a correspondence multigraph formalism to extract connected components conserved in multiple networks, is presented and applied on PPInetworks. C3Part-M is compared with NetworkBlast-M [29], another technique more recently proposed on the basis of a novel representation of multiple networks that is linear only with respect to their size.
24.5 Concluding Remarks
In both biosequences and biological networks, the presence of repetitions is usually associated with biologically significant conservations. Thus several techniques have been proposed in the literature to extract interesting repetitions from biological data, and different formulations of such a problem are possible, as we showed in this chapter.
When biological networks are considered, the extraction of interesting similarities involves the subgraph isomorphism problem, which is known to be NP-complete [27]. For this reason, some of the approaches, described [e.g., 48,55] search for repeated structures simpler than graphs, such as trees or paths. Furthermore, the number of existing approximate techniques is notably greater than the number of exact methods. In particular, exact approaches have been proposed when the size of the subgraphs to search for can be fixed a priori, such as in the case of querying and motif extraction. If exact algorithms are exploited, the size of subgraphs has to be restricted to only few nodes.
Some of the approaches reviewed in this chapter focus only on the topological similarity between the conserved subgraphs. Others also factor in information about node similarities in the process of extracting conserved regions, often relaxing topology constraints. Only a few methods have been presented that also apply edge information, such as reliability or different kinds of interaction. Considering both node and edge information seems to be a successful approach for analysis of biological networks. Indeed, in contrast to the biosequences domain, biological interaction data are often affected by noise because much information is retrieved by computational and high-throughput experimental techniques [28, 34].
A major challenge in biological networks analysis is the need to define more efficient algorithms capable of detecting significant repetitions occurring in a large number of networks. Indeed, the amount of available interaction data is increasing exponentially, and searching for common motifs in different networks could be useful in classifying the corresponding interactomes and identifying similar functional groups across species. While multiple sequence alignment has been massively exploited, multiple network alignment is still in its infancy, because such a task is computationally difficult for networks with thousands of nodes and interactions.
Finally, we point out that, although there has been some attempt to define statistical indices in the biological network domain [44], a general and universally accepted methodology for measuring the biological significance of the repetitions detected is still lacking.
References
1. Alon U, Network motifs: Theory and experimental approaches, Nature 8:450–461 (2007).
2. Apostolico A, Bock ME, Lonardi S, Monotony of surprise and large-scale quest for unusual words, J. Comput. Biol. 10(2/3):283–311 (2003).
3. Apostolico A et al, Finding 3d motifs in ribosomal rna structures, Nucleic Acids Res. 37(4):e29 (2008).
4. Bandyopadhyay S, Sharan R, Ideker T, Systematic identification of functional orthologs based on protein network comparison, Genome Res. 16(3):428–435 (2006).
5. Berg J, Lassig M, Local graph alignment and motif search in biological networks, Proc. Natl. Acad. Sci. USA 101(41):14689–14694 (2004).
6. Blin G, Sikora F, Vialette S, Querying graphs in protein-protein interactions networks using feedback vertex set, IEEE/ACM Trans. Comput. Biol. Bioinformatics. 7:628–635 (2010).
7. Brazma A et al, Approaches to the automatic discovery of patterns in biosequences, J. Comput. Biol. 5(2):277–304 (1998).
8. Chatraryamontri A et al, MINT: The molecular interaction database, Nucleic Acids Res. 35(database issue):D572–D574 (2006).
9. Cheadle C et al, Control of gene expression during t cell activation: Alternate regulation of mrna transcription and mrna stability, BMC Genomics 6(1):75 (2005).
10. Cheng C-Y, Huang C-Y, Sun C-T, Mining bridge and brick motifs from complex biological networks for functionally and statistically significant discovery, IEEE Trans. Syst. Man Cybernet. B 38(1):17–24 (2008).
11. Chindelevitch L, Liao C-S, Berger B, Local optimization for global alignment of protein interaction networks, Proc. Pacific Symp. Biocomputing, 2010, pp. 123–132.
12. Ciriello G, Guerra C, A review on models and algorithms for motif discovery in protein-protein interaction network, Brief. Funct. Genomics Proteomics 7(2):147–56 (2008).
13. International Human Genome Sequencing Consortium, Finishing the euchromatic sequence of the human genome, Nature 431(7011):931–945 (2004).
14. Denielou Y-P, Boyer F, Viari A, Sagot M-F, Multiple alignment of biological networks: A flexible approach, Proc. Combinatorial Pattern Matching'09, 2009, pp. 263–273.
15. Dost B et al, Qnet: A tool for querying protein interaction networks, Proc. RECOMB'07, 2007, pp. 1–15.
16. Durand P et al, GenoLink: A graph-based querying and browsing system for investigating the function of genes and proteins, BMC Bioinformatics 7(21):(2006).
17. Erdos P, Renyi A, On the evolution of random graphs, Publ. Mater. Inst. Hung. Acad. Sci. 5:17–61 (1960).
18. Ferraro N, Palopoli L, Panni S, Rombo S, Asymmetric comparison and querying of biological networks, IEEE/ACM Trans. Comput. Biol. Bioinformatics 8:876–889 (2011).
19. Ferro A et al, Netmatch: A cytoscape plugin for searching biological networks, Bioinformatics 23(7):910–912 (2007).
20. Fionda V, Palopoli L, Biological network querying techniques: Analysis and comparison, J. Comput. Biol. 18(4):595–625 (2011).
21. Fionda V, Palopoli L, Panni S, Rombo SE, Protein-protein interaction network querying by a “focus and zoom” approach, Bioinformatics Res. Devel. 13:331–346 (2008).
22. Fionda V, Panni S., Palopoli L, Rombo SE. Extracting similar sub-graphs across ppi networks, Proc. Int. Symp. Computing and Informatics Sciences, 183–188 (2009).
23. Fionda V, Panni S, Palopoli L, Rombo SE, A technique to search functional similarities in ppi networks, Int. J. Data Mining Bioinformatics, 3(4):431–453 (2009).
24. Flannick J et al, Graemlin: General and robust alignment of multiple large interaction networks, Genome Res. 16(9):1169–1181 (2006).
25. Francke C, Siezen RJ, Teusink B, Reconstructing the metabolic network of a bacterium from its genome, Trends Microbiol. 13(11):550–558 (2005).
26. Galil Z, Giancarlo R, Data structures and algorithms for approximate string matching, J. Complex. 4(1):33–72 (1988).
27. Garey M, Johnson D, Computers and Intractability: A Guide to the Theory of NP-completeness, Freeman, New York, 1979.
28. Ito T et al, A comprehensive two-hybrid analysis to explore the yeast protein interactome, Proc. Natl. Acad. Sci. USA 98(8):4569–4574 (2001).
29. Kalaev M, Bafna V, Sharan R, Fast and accurate alignment of multiple protein networks, Proc. RECOMB'08, 2008.
30. Karp PD et al, Expansion of the BioCyc collection of pathway/genome databases to 160 genomes, Nucleic Acids Res. 19:6083–6089 (2005).
31. Kelley BP et al, Conserved pathways within bacteria and yeast as revealed by global protein network alignment, Proc. Natl. Acad. Sci. USA 100(20):11394–11399 (2003).
32. Klau GW, A new graph-based method for pairwise global network alignment, BMC Bioinformatics 10(Suppl. 1):S59 (2009).
33. Koyuturk M et al, Pairwise alignment of protein interaction networks, J. Comput. Biol. 13(2):182–199 (2006).
34. Krogan NJ, Cagney G, et al, Global landscape of protein complexes in the yeast Saccharomyces cerevisiae, Nature 440(7084):637–643 (2006).
35. Lacroix V, Fernandes CG, Sagot M-F, Motif search in graphs: Application to metabolic networks, IEEE/ACM Trans. Comput. Biol. Bioinformatics 3(4):360–368 (2006).
36. Lesk A, Introduction to Protein Science Architecture, Function, and Genomics, Oxford Univ. Press, 2004.
37. Levine M, Davidson EH, Gene regulatory networks for development, Proc. Natl. Acad. Sci. USA 102:4936–4942 (2005).
38. Liao C-S et al, Isorankn: Spectral methods for global alignment of multiple protein networks, Bioinformatics 25:i253–i258 (2009).
39. Mangan S, Alon U, Structure and function of the feed-forward loop network motif, Proc. Natl. Acad. Sci. USA 100(21):11980–11985 (2003).
40. Mangan S, Itzkovitz S, Zaslaver A, Alon U, The incoherent feed-forward loop accelerates the response-time of the gal system of Escherichia coli, J. Mol. Biol. 356(5):1073–1081 (2005).
41. Matys V et al, Transfac and its module transcompel: Transcriptional gene regulation in eukaryotes, Nucleic Acids Res. 34:D108–D110 (2006).
42. Mewes HW et al, MIPS–a database for protein sequences, homology data and yeast genome information, Nucleic Acids Res. 25:28–30 (1997).
43. Miller JP et al, Large-scale identification of yeast integral membrane protein interactions, Proc. Natl. Acad. Sci. USA 102(34):12123–12128 (2005).
44. Milo R et al, Network motifs: Simple building blocks of complex networks, Science 298(5594):824–827 (2002).
45. Orlev N, Shamir R, Shiloh Y, PIVOT: Protein interaction visualization tool, Bioinformatics 20(3):424–425 (2004).
46. Parida L, Discovering topological motifs using a compact notation, J. Comput. Biol. 14(3):46–69 (2007).
47. Parida L, Pattern Discovery in Bioinformatics, Theory and Algorithms, Chapman & HAll/CRC, 2008.
48. Pinter R et al, Alignment of metabolic pathways, Bioinformatics 21(16):3401–3408 (2005).
49. Posada D, Bioinformatics for DNA Sequence Analysis, Humana Press, 2009.
50. Qian X, Sze S-H, Yoon B-J, Querying pathways in protein interaction networks based on hidden markov models, J. Comput. Biol. 16(2):145–57 (2009).
51. Rombo SE, Utro F, Giancarlo R, Basic statistical indices for SeqAn, in Gogol-Döring A, Reinert K, Biological Sequence Analysis Using the SeqAn C++ Library, Chapman&Hall/CRC Mathematical & Computational Biology Series, 2009, pp. 249–260.
52. Sharan R et al, From the cover: Conserved patterns of protein interaction in multiple species, Proc. Natl. Acad. Sci. USA 102(6):1974–1979 (2005).
53. Sharan R, Ideker T, Modeling cellular machinery through biological network comparison, Nat. Biotechnol. 24(4):427–433 (2006).
54. Shen-Orr SS, Milo R, Mangan S, Alon U. Network motifs in the trascriptional regulation network of Escherichia coli, Nature 31:64–68 (2002).
55. Shlomi T et al, Qpath: A method for querying pathways in a protein-protein interaction network, BMC Bioinformatics 7: (2006).
56. Singh R, Xu J, Berger B, Pairwise global alignment of protein interaction networks by matching neighborhood topology, Proc. Res. Comput. Mol. Biol., pp 16–31, (2007).
57. Singh R, Xu J, Berger B, Global alignment of multiple protein interaction networks, Proc. Pacific Symp. Biocomputing, pp. 303–14, (2008).
58. Stelling J, Klamt S, Bettenbrock K, Schuster S, Gilles ED. Metabolic network structure determines key aspects of functionality and regulation, Nature 420:190–193 (2002).
59. von Mering D, Krause C, et al., Comparative assessment of a large-scale data sets of protein-protein interactions, Nature 417(6887):399–403 (2002).
60. Yang Q, Sze S-H, Saga: A subgraph matching tool for biological graphs, J. Comput. Biol. 14(1):56–67 (2007).
61. Yeger-Lotem E et al., Network motifs in integrated cellular networks of transcription regulation and protein protein interaction, Proc. Natl. Acad. Sci. USA 101(16):5934–5939 (2004).
62. Zhang S, Zhang X-S, Chen L, Biomolecular network querying: A promising approach in systems biology, BMC Syst Biol. 2:5 (2008).
63. Zhou Q, Chipperfield H, Melton DA, Wong WH, A gene regulatory network in mouse embryonic stem cells, Proc. Natl. Acad. Sci. USA 104(42):16438–16443 (2007).