
Chapter 26
Biological networks–based analysis of gene expression signatures*
26.1 Introduction
Diagnostic and prognostic gene signatures for complex diseases is a major step toward better personal medicine. A gene signature is a group of genes whose expression pattern represents the status of a gene expression disease [1]. Identification of the gene signatures of disease subtypes, risk stratification, pathologic parameters, and clinical outcomes has the potential to help physicians and surgeons find a personal optimized treatment, avoid unnecessary medication, and reduce costs [2, 3].
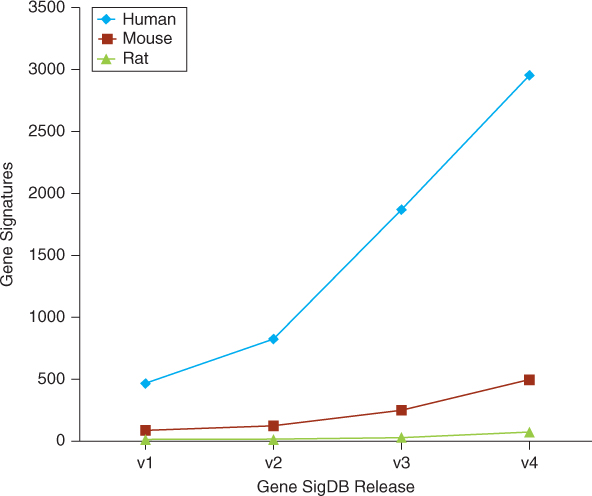
Various gene signatures are developed for various complex diseases, especially cancer. Since researchers found that gene expression signatures were able to predict clinical1 outcome of breast cancer in 2002 [4, 5], this method has become a hot topic and attracted the attention of both biologists and oncologists. Signatures for various phenotypes, such as poor prognosis [5], invasiveness [6], recurrence [7], and metastasis [8, 9], have been experimentally derived from patient groups and biological hypotheses. MammaPrint, a fully commercialized microarray-based 70-gene signature for breast cancer that was developed by Agendia (http://www.agendia.com/), was approved by FDA [10] in 2009. Because of rapid development of high-throughput tecniques, such as microarry, the number of gene signatures has grown quite rapidly. The first release of GeneSigDB [11], published in August 2009, contained only 575 gene signatures. In the latest release, GeneSigDB contains 3515 gene signatures for more than 50 tissues, and diseases of three species are collected from 1604 published articles. Figure 26.1 shows the growth of gene signatures in the GeneSigDB. Because of space limitation, we cannot list them one by one. Details of these gene signatures can be found in GeneSigDB (http://compbio.dfci.harvard.edu/genesigdb/).
Figure 26.1 Growth of GeneSigDB. (Source: From Culhane et al. [11]).
However, as pointed out in several articles, distinct signatures share very few genes, even though they paradoxically occupy a common prognosis space [12–14]. For both cancer biologists and oncologists, there are two critical problems: (1) how to explain the lack of overlap among gene signatures for a common diseases and (2) whether these disjoint genetic signatures can provide a unified insight into the relationship between gene expression and clinical outcome.
Meanwhile, biological networks, such as protein interaction networks and gene coexpression networks, are becoming popular in many studies, including the study of gene signatures of complex diseases. Computational biologists have developed many methods to identify gene signatures by combining gene expression profiles, biological networks, and other related data. Using data on biological networks, researchers also want to integrate different gene signatures by considering the interactions among genes.
The rest of this chapter is organized as follows: a brief introduction of gene signatures is provided in Section 26.2; biological network–based identification of gene signatures is described in Section 26.3; in Section 26.4, we discuss protein interaction network–based integration of different gene signatures; and discussion and conclusion are provided in the Section 26.5.
26.2 Gene expression signatures
26.2.1 Identification of Gene Signatures
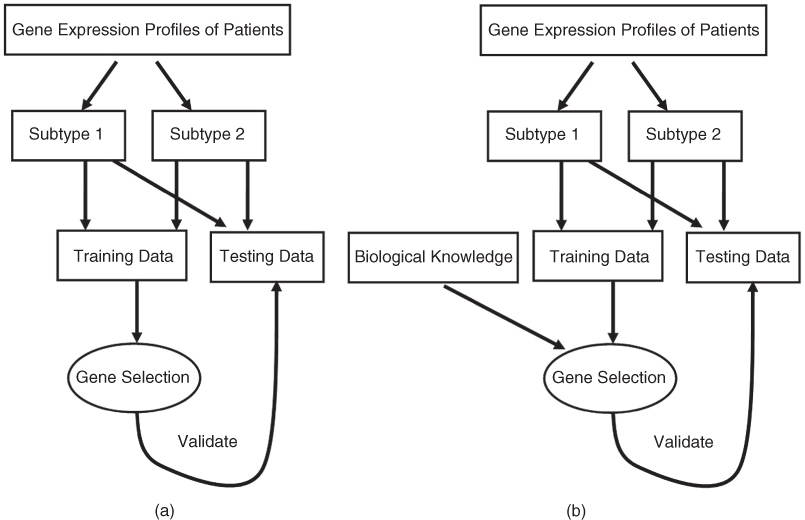
Analysis of the gene signatures in GeneSigDB release 4 reveals that the most common array platforms were Affymetrix platforms, particularly u133a and u133plus2 arrays. However, the computational methods used to select genes from the experimental results to construct gene signatures are vary significantly in different studies. Basically, as shown in Figure 26.2, these different methods can be divided into two classes, top–down (data-driven) approaches and the ‘bottom–up’ (hypothesis-driven) approaches [14]:
Figure 26.2 Overview of data-driven (a) and hypothesis-driven (b) approaches.
26.2.2 Low Overlap among Signatures
As mentioned elsewhere [12–14, 17], there is very small overlap among different gene signatures. To validate this observation, we obtained 94 human breast cancer gene signatures from the GeneSigDB release 2. Because of the different generation methods and the various purposes of these signatures, the size of these signatures are very different. The largest signature contains 3260 genes, and the smallest signature contains only 4 genes. The median size of these signatures is 46.
To evaluate the similarity among these gene signatures, we analyze the overlap among the 94 gene signatures (see Table 26.1). The analysis result is very consistent with the results reported in previous literature. A very small overlap is found among different signatures. While 4143 (58.6% of the total number) genes are found in only one signature, only 24(0.4%) genes overlapped among 10 or more signatures, and none of the genes overlapped among all 94 signatures. The lack of overlap is an obstacle to biological intepretation of the gene signatures and also indicates that the gene signatures identified by most existing methods are not sufficiently stable.
Table 26.1 Overlap among 94 Breast Cancer Gene Signatures
| Frequency | Number of Genes |
| 1 | 4143 |
| 2 | 1608 |
| 3 | 687 |
| 4 | 323 |
| 5 | 148 |
| 6 | 56 |
| 7 | 40 |
| 8 | 23 |
| 9 | 15 |
| 10 | 13 |
| 11 | 4 |
| 12 | 3 |
| 14 | 1 |
| 15 | 1 |
| 16 | 1 |
| 17 | 1 |
26.2.3 Possible Explanation of Low Overlap
Obviously, complex heterogeneity of signatures is possibly caused by different probe design, different platforms, or inadequate patient samples, and becomes an obstacle in interpretation and integration of various signatures of complex diseases. Gene ontology enrichment, pathway analysis, and some genome-scale methods are proposed to explain the lack of overlap [14, 18, 19]. Van Vliet et al. [18], list five possible explanations for the small overlap between signatures:
Through a large-scale analysis performed on 947 breast cancer samples from Affymetrix platform, Van Vliet et al. [18] conclude that the small signature overlap is most likely due to small sample size problem (explanation 5). However, the conclusion might be specific to the datasets and the specific techniques used in their work. By comparison of three prognostic gene expression signatures for breast cancer, Haibe-Kains et al. [14] suggested that the small overlap between the different prognostic gene signatures resulted because these different signatures represented largely overlapping biological processes (explanation 3). By taking into account the biological knowledge that exists among different signatures, Blazadonakis et al. [19] found that different signatures are similar at biological level, rather than gene level (explanation 3). Much work has been done in an effort to understand the small overlap between gene signatures, but so far there is no widely accepted explanation. Actually, explanation 3 indicates that the small overlap among gene signatures is caused by the complex interactions between genes and gene products. The interactions among genes and gene products can berepresented as biological networks. Therefore, protein interaction networks can be used to identify stable gene signatures and interpret the relationship among them.
26.3 Biological Network–based identification of gene expression signatures
As is well known, virtually no biological moleculars, such genes and proteins, can perform biological function individually. They always associate together to achieve some particular functions. Therefore, various moleculars probably associate together to influence the states and outcome of diseases. Biological networks consisting of biological molecules and the interactions among them allow us to uncover the functions of genes and proteins at network level. Therefore, by incorporating biological networks, gene expression profiles, and other clinical data, we can investigate the relationship between complex diseases and genes to find the gene signatures of complex diseases.
An important work in this field is that by Chuang et al. [6], who proposed a protein interaction network–based approach that identifies biomarkers to predict the likelihood of metastasis in unkonwn samples. In this study, they identified biomarkers not as individual genes but as subnetworks extracted from protein interaction databases. Protein interaction networks and gene expression profiles of different phenotypes are integrated in this study. First, they divided the protein interaction network into subnetworks. Then, each subnetwork was scored to assess its activity in each patient, defined by averaging its normalized gene expression values. Finally, the discriminative potential of each subnetwork was computed on the basis of the mutual information between its activity score and the metastatic/non-metastatic disease status over all patients. Significantly discriminative subnetworks were identified by comparing their discriminative potentials to those of random networks and used to classify the cancer patients. Compared with traditional analysis methods, the classification accuracy of metastasis of network-based method was higher. The subnetwork biomarkers identified by this network-based method are more informative and reproducible across datasets.
By integrating high-quality human protein interactions and a computationally derived phenotype similarity score, Lage et al. [20] performed a systematic, large-scale analysis of human protein complexes comprising gene products implicated in many different categories of human disease and created a phenome–interactome network. Using a phenomic ranking of protein complexes linked to human diseases, they developed a predictor for many complex diseases, such as retinitis pigmentosa, epithelial ovarian cancer, inflammatory bowel disease, amyotrophic lateral sclerosis, Alzheimer disease, type 2 diabetes, and coronary heart disease.
Taylor et al. [21] analyzed hub proteins in human protein interaction networks. They found signaling domains more often in intermodular hub proteins that are coexpressed with their interacting partners in a tissue-restricted manner and also more frequently associated with oncogenesis. By analyzing two breast cancer patient cohorts, they found that altered modularity of the human interactome may be useful as an indicator of breast cancer prognosis. They developed a prognostic gene signature of breast cancer that consists of the hub proteins whose relative expression with each of their interacting partners differed significantly between patients who survived versus those who died from disease.
By integrating protein interaction networks and gene–gene coexpression networks, Erik van den Akker et al. proposed a nongreedy method for dissecting the interaction network into a set of disjoint subnetworks that are functionally coherent to improve gene signatures for classifying breast cancer metastasis [22].
Since 2010, Guo et al. have developed a series of implication networks methods for identification of gene signatures of various complex diseases [23–30]. They [27, 29] used implication networks based on prediction logic to construct genomewide coexpression networks for different disease states and then selected candidate genes that coexpressed with major disease signal hallmarks. Finally, they used the univariate Cox model and Relief algorithm to select the top genes that were most predictive of clinical outcome to construct the gene signature for non–small cell lung cancer. A 13-gene lung cancer prognosis signature with significant prognostic stratifications is identified by this method. To predict lung cancer risk and survival, they developed a smoking associated six-gene signature [28]. In this study, they developed an induction algorithm based on prediction logic to generate implication networks that were used to infer the relevance of signaling pathways in a set of selected genes associated with smoking and lung cancer survival.
As described above, biological networks, such as gene coexpression networks and protein interaction networks, are combined with gene expression profiles of patients with different disease status to identify gene signatures and achieved much success.
26.4 Biological Network–based integration of gene expression signatures
As shown in Section 26.2.1, the overlap among different gene signatures is very limited. It is difficult to interpret the lack of overlap and integrate different signatures if we don't consider the functional and physical interactions among genes and proteins. The interactions among genes and proteins consist of biological networks. Therefore, many network-based explanations are proposed to explain the lack of overlap among gene signatures. Furthermore, on the basis of data on biological networks, researchers also want to integrate different signatures toprovide a unifed insight to the relationship between gene expression and diseases.
By single-protein analysis of networks (SPAN [31]) and conservative permutation resampling, a small but more biologically significant breast cancer signature consisting of 54 genes is identified from a protein interaction network, including 250 cancer-related genes reported in the literatures [17, 32].
By taking into account the biological knowledge that exists among different signatures, and applying it as a means of integrating the signatures and refining their statistical significance on the datasets, Blazadonakis et al. [19] derived a unified signature that is significantly improved over its predecessors in terms of performance and robustness. Their motive in this approach was to assess the problem of evaluating different signatures not in a competitive but rather in a complementary manner, where one is treated as a pool of knowledge contributing to a global and unified solution.
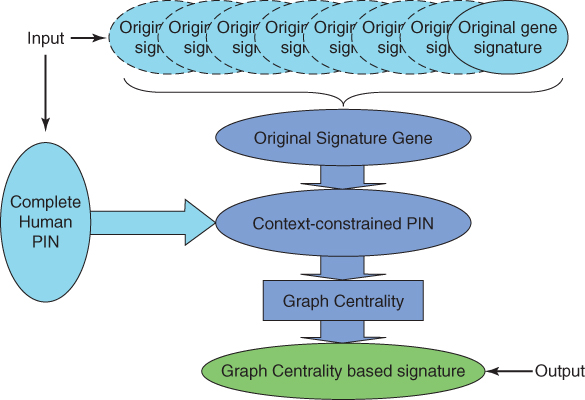
Wang et al. [12] proposed a graph centrality method to integrate different gene signatures of breast cancer. As shown in Figure 26.3, they constructed a context-constrained protein interaction network of breast cancer by integrating different gene signatures of breast cancer and protein interaction data. Then, they selected a given number of genes that have high graph centrality to construct the integrated gene signature. According to gene ontology and KEGG pathway enrichment analysis, the graph centrality gene signatures are closely related to cancers. Microarray datasets of breast cancer patients from the GEO database are used to validate the graph centrality gene signatures. According to the expression profiles of the gene signatures, the breast cancer patients are divided into two groups with different clinical parameters.
Figure 26.3 Overview of the graph centrality integration method proposed by Wang et al. [12].
Frohlich [33] has developed an alogirthm to obtain a consensus gene signature from six different gene signatures for breast cancer. First, they clustered genes from different gene signatures based on their shortest-path distance in a protein interaction network. Then, for each cluster, they identified lowest common ancestors (LCAs), which are proteins that are commonly upstream of a set of proteins and thus may exhibit a certain regulatory influence. Finally, the set of LCAs and the set of genes appearing in the majority of signatures form their consensus gene signature.
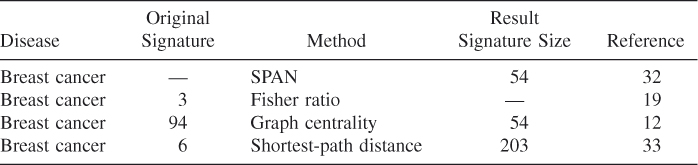
As presented in Table 26.2, all these integration methods are based on breast cancer data. However, besides the interactions among genes and proteins, different cancers and diseases are also associated with each other. A unified gene signature of similar diseases can be constructed by incorporating gene expression profiles, protein interaction networks, and the relationship among diseases.
Table 26.2 Summary of Gene Signature Integration Methods
26.5 Discussion and Conclusion
Biological networks are widely used in various biomedical researches, such as prediction of the function of biological moleculars, identification of protein complexes, and functional modules. More recently, biological networks such as gene coexpression networks and protein interaction networks have been used to identify and integrate gene signatures of complex diseases. Research reviewed in this chapter proves that biological networks are effeicient in identifying robust, informative, and reproducible gene signatures.
Although many successes have been made, many problems have to be solved. First, most existing gene signatures focus on one specific status of disease. By integrating various biological networks and clinical information, researchers need to develop gene signature of multistatus disease to provide a unified insight into the disease mechanism. In addition, most existing network-based gene signature identification and integration methods are designed for static biological networks. As is well known, biological networks are dynamic systems. Researchers can reconstruct dynamic biological networks by integrating various data, such as time series gene expression data. Gene signatures from such dynamic networks should be more informative. The last but also the most important issue is the fact that network-based gene signatures still lack overlap. Similar to traditional methods, gene signatures identified by different network-based methods are very different. Comprehensive analysis and novel methods are needed to solve these problems.
References
1. Itadani H, Mizuarai S, Kotani H, Can systems biology understand pathway activation? Gene expression signatures as surrogate markers for understanding the complexity of pathway activation, Curr. Genomics 9(5):349–360 (2008).
2. van't Veer LJ, Bernards R, Enabling personalized cancer medicine through analysis of gene-expression patterns, Nature 452(7187):564–570 (April 2008).
3. Subramanian J, Simon R, Gene expression-based prognostic signatures in lung cancer: Ready for clinical use? J. Natl. Cancer Inst. 102(7):464–474 (April 2010).
4. van 't Veer LJ, Dai H, van de Vijver MJ, et al, Gene expression profiling predicts clinical outcome of breast cancer, Nature 415(6871):530–536 (Jan. 2002).
5. van de Vijver MJ, He YD, van 't Veer LJ, et al, A gene-expression signature as a predictor of survival in breast cancer, New Engl. J. Med. 347(25):1999–2009 (Dec. 2002).
6. Chuang H-Y, Lee E, Liu Y-T, Lee D, Ideker T, Network-based classification of breast cancer metastasis, Mol. Syst. Biol. 3:140 (2007).
7. Paik S, Shak S, Tang G, et al, A multigene assay to predict recurrence of tamoxifen-treated, node-negative breast cancer, New Engl. J. Med. 351(27):2817–2826 (Dec. 2004).
8. Minn AJ, Gupta GP, Siegel PM, et al, Genes that mediate breast cancer metastasis to lung, Nature 436(7050):518–524 (July 2005).
9. Wang Y, Klijn JGM, Zhang Y, et al, Gene-expression profiles to predict distant metastasis of lymph-node-negative primary breast cancer, Lancet 365(9460):671–679 (2005).
10. Slodkowska EA, Ross JS, Mammaprint 70-gene signature: Another milestone in personalized medical care for breast cancer patients, Expert Rev. Mol. Diagn. 9(5):417–422 (July 2009).
11. Culhane AC, Schrder MS, Sultana R, Picard SC, Martinelli EN, Kelly C, Haibe-Kains B, Kapushesky M, St Pierre AA, Flahive W, Picard KC, Gusenleitner D, et al, Genesigdb: A manually curated database and resource for analysis of gene expression signatures, Nucleic Acids Res. 40(1):D1060–D1066 (Jan. 2012).
12. Wang J, Chen G, Li M, Pan Y, Integration of breast cancer gene signatures based on graph centrality, BMC Syst. Biol. 5(Suppl. 3):S10 (2011).
13. Gnen M, Statistical aspects of gene signatures and molecular targets, Gastrointest. Cancer Res. 3(2 Suppl.):S19–S21 (March 2009).
14. Haibe-Kains B, Desmedt C, Piette F, Buyse M, Cardoso F, van't Veer L, Piccart M, Bontempi G, Sotiriou C, Comparison of prognostic gene expression signatures for breast cancer, BMC Genomics 9:394 (2008).
15. Sotiriou C, Wirapati P, Loi S, Harris A, Fox S, Smeds J, Nordgren H, Farmer P, Praz V, Haibe-Kains B, Desmedt C, Larsimont D, Cardoso F, Peterse H, et al, Gene expression profiling in breast cancer: Understanding the molecular basis of histologic grade to improve prognosis, J. Natl. Cancer Inst. 98(4):262–272 (Feb. 2006).
16. Jeffs AR, Glover AC, Slobbe LJ, Wang L, He S, Hazlett JA, Awasthi A, Woolley AG, Marshall ES, Joseph WR, Print CG, Baguley BC, Eccles MR, A gene expression signature of invasive potential in metastatic melanoma cells, PLoS One 4(12):e8461 (2009).
17. Chen J, Sam L, Huang Y, et al, Protein interaction network underpins concordant prognosis among heterogeneous breast cancer signatures, J. Biomed. Informatics 43(3):385–396 (2010).
18. van Vliet MH, Reyal F, Horlings HM, et al, Pooling breast cancer datasets has a synergetic effect on classification performance and improves signature stability, BMC Genomics 9:375 (2008).
19. Blazadonakis ME, Zervakis ME, Kafetzopoulos D, Complementary gene signature integration in multiplatform microarray experiments, IEEE Trans. Inform. Technol. Biomed. 15(1):155–163 (Jan. 2011).
20. Lage K, Karlberg EO,Størling ZM, et al, A human phenome-interactome network of protein complexes implicated in genetic disorders, Nat. Biotechnol. 25(3):309–316 (March 2007).
21. Taylor IW, Linding R, Warde-Farley D, Liu Y, Pesquita C, Faria D, Bull S, Pawson T, Morris Q, Wrana JL, Dynamic modularity in protein interaction networks predicts breast cancer outcome, Nat. Biotechnol. 27(2):199–204 (Feb. 2009).
22. van den Akker EB, Verbruggen B, Heijmans BT, Beekman M, Kok JN, Slagboom PE, Reinders MJT, Integrating protein-protein interaction networks with gene-gene co-expression networks improves gene signatures for classifying breast cancer metastasis, J. Integrative Bioinformatics 8(2):188 (2011).
23. Mettu RKR, Wan Y-W, Habermann JK, Ried T, Guo NL, A 12-gene genomic instability signature predicts clinical outcomes in multiple cancer types, Int. J. Biol. Markers 25(4):219–228 (Nov. 2010).
24. Wan Y-W, Qian Y, Rathnagiriswaran S, Castranova V, Guo NL, A breast cancer prognostic signature predicts clinical outcomes in multiple tumor types, Oncol. Reports 24(2):489–494 (Aug. 2010).
25. Wan Y-W, Sabbagh E, Raese R, Qian Y, Luo D, Denvir J, Vallyathan V, Castranova V, Guo NL, Hybrid models identified a 12-gene signature for lung cancer prognosis and chemoresponse prediction, PLoS One 5(8):e12222 (2010).
26. Wan Y-W, Beer DG, Guo NL, Signaling pathway-based identification of extensive prognostic gene signatures for lung adenocarcinoma, Lung Cancer 76(1):98–105 (April 2012).
27. Wan Y-W, Bose S, Denvir J, Guo NL, A novel network model for molecular prognosis, in Proc. 1st ACM Int. Conf. Bioinformatics and Computational Biology (BCB'10), Assoc. Computing Machinery, New York, 2010, pp. 342–345.
28. Guo NL, Wan Y-W, Pathway-based identification of a smoking associated 6-gene signature predictive of lung cancer risk and survival, Artif. Intell. Med. 55(2):97–105 (Feb. 2012).
29. Guo NL, Wan Y-W, Bose S, Denvir J, Kashon ML, Andrew ME, A novel network model identified a 13-gene lung cancer prognostic signature, Int. J. Comput. Biol. Drug Design 4(1):19–39 (2011).
30. Wan Y-W, Xiao C, Guo NL, Network-based identification of smoking-associated gene signature for lung cancer, Proc. IEEE Int. Bioinformatics and Biomedicine (BIBM) Conf., 2010. pp. 479–484.
31. Lee Y, Yang X, Huang Y, Fan H, et al, Network modeling identifies molecular functions targeted by mir-204 to suppress head and neck tumor metastasis, PLoS Comput. Biol. 6(4):e1000730 (2010).
32. Chen JL, Li J, Stadler WM, Lussier YA, Protein-network modeling of prostate cancer gene signatures reveals essential pathways in disease recurrence, J. Am. Med. Inform. Assoc. 18(4):392–402 (July 2011).
33. Frohlich H, Network based consensus gene signatures for biomarker discovery in breast cancer, PLoS One 6(10):e25364 (2011).
1 This work is supported in part by the National Natural Science Foundation of China under Grants 61003124 and 61073036