Your drawing is intelligent in many ways. For example, several commands can give you the details of each object. In addition, you can view listings that provide information about your drawing as a whole. You can also list system variables, which I've mentioned previously in this book, along with their current settings.
You can perform calculations on objects that may assist you in certain drawing tasks. For example, you can divide an object into any number of segments by placing point objects along the object, or you can place point objects at a specified distance along the object. You can use AutoCAD's calculator, which not only does regular numerical calculations but also works with coordinates and geometric points on objects. This chapter shows you how to discover the hidden data in your drawing.
Some information applies to the drawing as a whole or even to your computer system as a whole, rather than to individual objects. This information can be important when there is a problem or when you simply need to find the status of system variables.
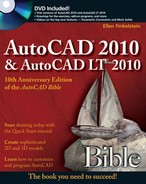
The STATUS command is available only in AutoCAD and provides a standard list of information that can be very helpful. The most common use for STATUS is to troubleshoot problems. You can send the listing to a colleague in another office who needs to work on the same drawing. Your colleague can then work more easily by using the same settings that you have used. Enter status
The command lists the number of objects in your drawing, followed by the limits and extents of the drawing, and the extents of the current display on your screen. Other items are the snap and grid spacing as well as the current layer, color, linetype, and lineweight.
Obviously, much of this information is available without using the STATUS command. The easiest items to find are the current layer, color, linetype, and lineweight, which are visible in the Layers and Properties panels on the Home tab of the ribbon. However, you would have to use a number of commands to obtain other information such as the snap and grid spacing and the drawing limits. STATUS puts it all together in one listing.
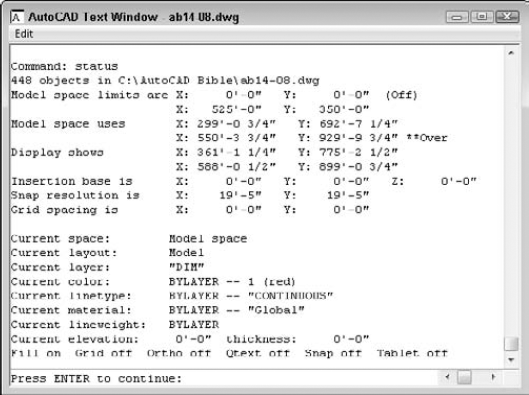
The SETVAR command provides a listing of all the system variables and their settings. It may be quicker to view system-variable settings by using the SETVAR command than by typing each individual system variable on the command line. For more information about how AutoCAD and AutoCAD LT store settings in system variables, see Chapter 5.
Too many system variables exist to show the entire listing here, but a few can convey the wealth of information that is available, as shown in Figure 12.2.
Note
Read-only system variables are for information only and cannot be changed. An example is LOGINNAME (AutoCAD only), which shows the name of the current user who is registered on the system. Other system variables can be changed.
Although some system variables allow a variety of values, many are either on or off. In general, a setting of 1 means on and 0 means off.
You can set most system variables in a dialog box. For example, in Chapter 11 you set the LTSCALE system variable in the Linetype Manager. However, some system variables can be accessed only by typing them on the command line.
You can use SETVAR to set system variables that are not read-only, as well as to list them. To list the system variables, enter setvar
If you type a variable, the command prompts you for a new value so that you can change it. For example, if you type celtscale
You can track the time you spend working on a drawing. This feature is most often used for billing time to clients, or when your boss wants to see how much you're accomplishing.
Note
Chapter 17 covers the PLOTSTAMP command, which can optionally make a log file of plotting activity. Chapter 26 explains how to keep a log file of your overall drawing activity.
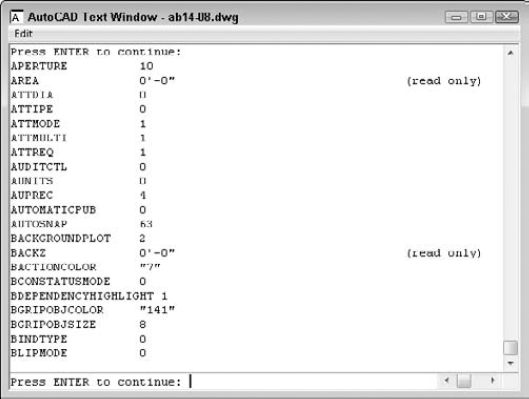
The following explains the listing that you see when using the TIME command:
Current time. The current date and time. The time is displayed to the nearest millisecond.
Created. The date and time when the drawing was created.
Last updated. The date and time of the last save of the drawing.
Total editing time. Accumulates the time spent in the drawing from session to session, not including plotting time or time that you worked on the drawing and quit without saving your changes.
Elapsed timer. Also accumulates time spent in the drawing, although you can turn this feature on and off and reset it.
Next automatic save in. Shows when your drawing will automatically be saved. Choose Application Button

You can think of total editing time as your car's odometer, and elapsed time as a timer that is similar to a trip meter that some cars have to enable you to time a specific trip.
At the end of the listing, you see the Enter option [Display/ON/OFF/Reset]: prompt. The Display option re-displays the listing with updated times. ON and OFF turn the elapsed time on and off. The Reset option resets the elapsed time to zero.
Note
The Express Tools contain a tool called EDITTIME (enter edittime
Note
The drawing used in the following exercise on obtaining drawing information, ab12-a.dwg, is in the Drawings folder on the DVD.
STEPS: Obtaining Drawing Information
Open
ab12-a.dwgfrom the DVD.
Type setvar

Press Enter to start the SETVAR command again. At the
Enter variable name or [?]:prompt, type ltscaleType time
Do not save this drawing. Leave the drawing open if you're going on to the next exercise.
Several commands and features exist solely to provide information about the objects in your drawing.
The LIST command displays information about selected objects. The information displayed depends on the object. For example, the LIST command gives you the radius of a circle and the length of a line.
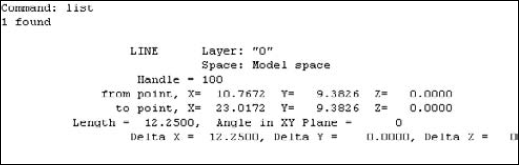
Table 12.1 explains the information that you see when you list an object.
Table 12.1. LIST Command Information
Data | Comments |
|---|---|
Layer | Lists the object's layer. If the color and linetype are not ByLayer or ByBlock, then AutoCAD lists these as well. |
Space | Tells you whether the object is in model space or paper space. (Chapter 17 covers paper space.) |
Handle | Every object in your drawing has a handle. Your drawing's internal database uses handles to keep track of objects. |
From point | Because the example in Figure 12.4 lists a line, it shows the start point. |
To point | The endpoint of the line. |
Length | The line's length. |
Angle in XY Plane | The line's angle. This line is horizontal, and so its angle is zero. |
Delta X | The change in the X coordinate from the start point to the endpoint. |
Delta Y | The change in the Y coordinate from the start point to the endpoint. |
Delta Z | The change in the Z coordinate from the start point to the endpoint. |
The Layer Control drop-down list in the Layers panel and drop-down lists in the Properties panel make it easy to tell an object's layer, linetype, and color. Later in this chapter, I explain how you can use the Properties palette and Quick Properties panel to see most of the same information, plus other information; you can also use them to change the information.
X = 61'-5 1/8″ Y = 32'-4 5/8″ Z = 0'-0″
Warning
If you're working in 3D, be aware that if you check the Replace Z Value with Current Elevation check box on the Drafting tab of the Options dialog box, you may get inaccurate results when you pick points for the ID and DIST commands. For more information on this option, see Chapter 21, where I discuss 3D coordinates.
The MEASUREGEOM command measures distance, radius, angle, area, and volume. You can use this information to check dimensions (covered in Chapter 14) or to make calculations that you need for drawing. To start the MEASUREGEOM command, choose Home tab
Note
MEASUREGEOM takes the place of the AREA, DIST, and MASSPROP commands of previous releases, and adds ways to easily measure radii and angles.
Here's how to use the options:


Volume. Specify the first corner point and then subsequent points, in a roundabout manner (not diagonally opposing corners), all on the XY plane, and press Enter to get the total. Then enter a height. Or, use the Object suboption to select an object. (You can select a 2D object and specify a height.) You can also use the Add Volume suboption to keep a running total, and the Subtract Volume suboptions to remove volumes, until you get just the combination of volumes that you want.
You can use any means of specifying the necessary points, but remember that object snaps or snap mode are useful for accuracy. Here is a typical display for a vertical line:
Distance = 5.7500,  Angle in XY Plane = 0,  Angle from XY Plane = 0
Delta X = 5.7500,  Delta Y = 0.0000,  Delta Z = 0.0000
After using an option, type x
Note
The precision set in the Drawing Units dialog box (Application Button
You can also use the BOUNDARY command to create one polyline or region from a complex area. (Chapter 16 covers boundaries and polylines.) You can then use the MEASUREGEOM's Area option and its Object suboption instead of picking points.
Note
The drawing used in the following exercise on using the MEASUREGEOM command, ab12-a.dwg, is in the Drawings folder on the DVD.
STEPS: Measuring Geometry
Open
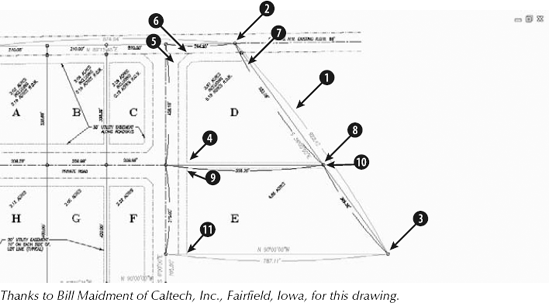
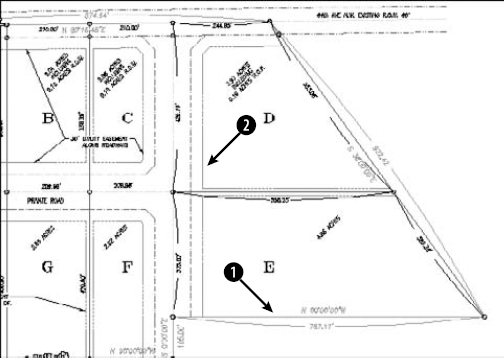
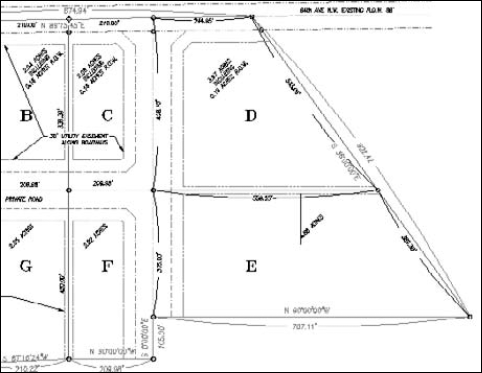
ab12-a.dwgfrom the DVD.Choose Zoom on the status bar and define a window to zoom in on the parcels of land labeled D and E, as shown in Figure 12.5. Object Snap should be on with a running object snap for Endpoint.


Distance = 922.42,  Angle in XY Plane = S 36d0'0″ E,  Angle from XY Plane = E
Delta X = 542.18,  Delta Y = −746.25,  Delta Z = 0.00

X = 6065.67 Y = 3775.58 Z = 0.00

Area = 123575.16, Perimeter = 1480.17
Total area = 123575.16
At the
Specify first corner point or [Object/Subtract area/eXit]:prompt, pick
Area = 183399.88, Perimeter = 1884.62
Total area = 306975.04
Do not save the drawing. Keep it open if you're continuing to the next exercise.
Note
The MASSPROP command is mostly used for 3D drawings, but it can also be used on regions, which are 2D solid surfaces, such as a shape cut from sheet metal. This command provides area and perimeter but also other engineering calculations, such as centroids, moments of inertia, the product of inertia, and so on. Chapter 24 covers this command further.
You can also obtain information about an object by selecting it and opening the Properties palette. Choose View tab
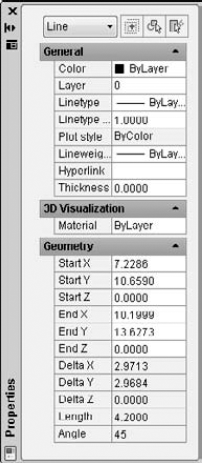
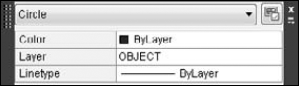
Figure 12.7. The Quick Properties panel pops up when you select an object and displays editable properties for that object.
Click the Quick Properties button on the status bar to turn off the Quick Properties panel. You can customize what properties appear on the Quick Properties panel. For more information, see Chapter 29.
Note
The DVD contains three routines that provide information about your objects. Linesum provides the total length of selected lines. Arcsum adds the lengths of selected arcs. Polydis provides the length of a selected polyline. Look in the SoftwareChapter 12 folder.
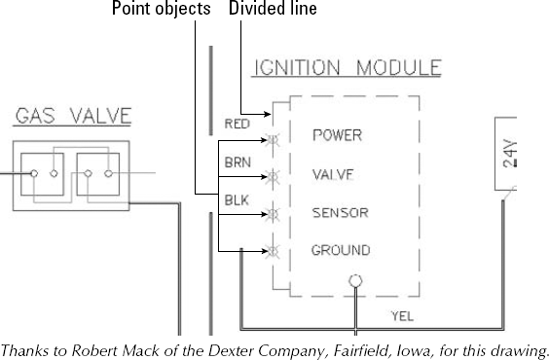
The DIVIDE command divides an object into equally spaced sections. The MEASURE command divides an object into sections of a specified length. These commands are useful in many fields. For example, you may need to space bolt holes evenly around the edge of a bushing, or place fence studs along the edge of a plot every 5 feet.
The DIVIDE command divides an object into equal sections. DIVIDE does not break the object — it simply places point objects along the selected object. You can use the Node object snap if you want to draw from those points.
Note
Remember that you can set the point display by choosing Home tab
For example, to create eight segments, you need to place seven point objects. If you have in your mind the number of point objects that you want, simply add one when specifying the number of segments.
You can use the Block option to place a block of your choice along the object rather than a point object. The block must exist in your drawing. (Chapter 18 covers blocks.) If you choose the Block option (right-click and choose Block), the option responds with the Enter name of block to insert: prompt. Type the name of the block. The prompt asks, Align block with object? [Yes/No] <Y>. Answer Y or N, depending on whether you want to align the block with the angle of the object.
Figure 12.8 shows an electrical schematic. Here you want to divide a line so that you can evenly space wires entering the ignition module. Four wires need to come in so that the line is divided into five segments by an easy-to-see point object.
You can practice using the DIVIDE command after the next section.
The MEASURE command is similar to the DIVIDE command, except that you specify the distance between point objects rather than the total number of segments. The command starts measuring from the endpoint closest to where you pick the object. MEASURE does not break the object — it simply places point objects along the object. You can use the Node object snap if you want to draw from those points.
Remember that you can set the point display by choosing Home tab
As with the DIVIDE command, you can place a block along the object by using the Block option, as long as the block exists in your drawing. The option prompts you for the name of the block and lets you choose whether you want to align the block with the object. The prompt asks for the segment length, and you type in the lengths between the points, as described earlier.
Note
The drawing in the following exercise on using the DIVIDE and MEASURE commands, ab12-a.dwg, is in the Drawings folder on the DVD.
STEPS: Using the DIVIDE and MEASURE Commands
Open
ab12-a.dwgfrom the DVD if it isn't already open from the previous exercise.If you didn't do the previous exercise, choose Zoom on the status bar and specify a window to zoom in to the parcels labeled D and E, as shown in Figure 12.9.
Choose Home tab


Do not save your drawing. Keep it open if you're continuing to the next exercise.
Note
The CAL command, which is the command-line calculator available in earlier releases of AutoCAD only, still exists. In fact, it's available in AutoCAD LT as well.
Tip
Press the Num Lock key on your keyboard and use your numerical pad to enter numbers into the calculator.
The History area stores previous calculations. You can reuse History area data by double-clicking the expression or the result that you want. This places the data in the input area. First be sure to clear the input area of current data, if you don't want to keep it.
Calculating numbers is straightforward and uses standard rules of precedence. For example, if you type 3*(2+3)/5-1
Let's say that you want to draw a horizontal line. You know it has to be the total of two other lines whose length you know. Follow these steps:
Specify first point: Pick the start point for the line. Specify next point or [Undo]:
Type'quickcalc(The QuickCalc window opens.)Press the Num Lock key.
In the Input area of the QuickCalc window, delete the 0.
Type 3.953+6.8725
Click the Apply button at the bottom of the calculator. The QuickCalc window disappears and the sum appears on the command line.
Move the cursor to the right so that you can use Direct Distance Entry to draw at a zero-degree angle.
Press Enter to draw the line segment.
Continue the LINE command or press Enter to end the command.
You can use feet and inches as well. Use the format 6'5″ or 6'-5″. Don't put any spaces between the feet and inches. With the calculator, all inches must be marked with a double prime (″), unlike regular AutoCAD command-line usage. Note that your drawing must use architectural units for this technique to work properly. (For more information on using feet and inches, see the sidebar "Subtracting feet and inches in QuickCalc.")
The QuickCalc toolbar has several buttons that are shortcuts for often-used tasks:
In each case, you are returned to the drawing area to specify the point or points that you need. For example, to draw a line the same length as another line, follow these steps:
Start the line.
Start QuickCalc transparently.
Click the Distance Between Two Points button on the QuickCalc toolbar.
You then return to your drawing where you can specify two points by using any method, such as object snaps.
Back in QuickCalc, you see the distance in the Input area. Click Apply to paste this number into the command line.
Move the cursor in the direction that you want to draw, and press Enter to draw the line.
You can use coordinates in QuickCalc expressions. Coordinates are enclosed in square brackets. For example, if you want to draw a line that is equal to the length of two other objects in your drawing that you happen to know are 3.953 and 6.8725 units long, and you want the line to be at a 20-degree angle, then you can follow these steps:
Start the LINE command.
At the
Specify first point:prompt, specify your first point.At the
Specify next point or [Undo]:prompt, type 'quickcalc.In the calculator input box, type [@(3.953+6.8725)<20]
Click the Apply button at the bottom of the calculator. AutoCAD draws the line segment.
To draw a line to the center of the triangle, follow these steps:
Start the LINE command.
At the
Specify first point:prompt, pick any start point.At the
Specify next point or [Undo]:prompt, type 'quickcalcIn the QuickCalc input box, type (end+end+end)/3
Pick the three corners of the triangle in succession. The QuickCalc window reappears with a coordinate in the Input box.
Click Apply to draw the line.
You can use QuickCalc as a substitute for the From object snap. For example, at the Specify first point: prompt, you can start QuickCalc transparently and type mid+[3,−2.5]
QuickCalc has its own scientific calculator, which you can use to calculate advanced formulas. Table 12.2 lists these functions.
Table 12.2. CAL Mathematical Functions
What It Does | |
|---|---|
| Calculates the sine of the angle |
| Calculates the cosine of the angle |
| Calculates the tangent of the angle |
| Calculates the arc sine of the real number |
| Calculates the arc cosine of the real number |
| Calculates the arc tangent of the real number |
| Calculates the natural log of the real number |
| Calculates the base-10 log of the real number |
| Calculates the natural exponent of the real number |
| Calculates the base-10 exponent of the real number |
| Calculates the absolute value of the real number (the number not including its + or − sign); this function is also used to calculate lengths |
| Rounds the number to its nearest integer |
| Truncates any decimal value leaving only the integer |
| Converts radian angles to degrees |
d2r(angle) | Converts degree angles to radians |
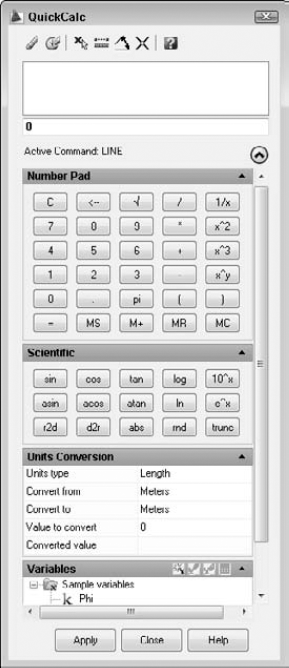
You can use the Units Conversion section of QuickCalc to convert units of length, area, volume, and angular measurements. For example, you can convert acres to square feet or meters to inches. Follow these steps:
If necessary, click the double down arrow to expand the Units Conversion section of QuickCalc.
From the Units Type drop-down list, choose the type of units that you want to convert.
From the Convert From drop-down list, choose the unit with which you want to start.
From the Convert To drop-down list, choose the unit to which you want to convert.
In the Value to Convert text box, type the value that you want to convert, and press Enter.

QuickCalc comes with some variables that you can use as part of calculated expressions. These include functions and one constant — the so-called Golden Ratio or Golden Number, Phi. Table 12.3 lists the functions and what they do.
Table 12.3. Special CAL Functions
Full Function | What It Does | |
|---|---|---|
| Gets the radius of the selected object. | |
| dist(end,end) | Calculates the distance between two points; you can also use the Distance Between Two Points button on the QuickCalc toolbar. |
| ill(end,end,end,end) | Calculates the intersection of two lines based on their four endpoints; you can also use the Intersection of Two Lines Defined by Four Points button on the QuickCalc toolbar. |
| (end+end)/2 | Calculates the midpoint between two endpoints. |
| nor(end,end) | Calculates a one-unit vector in the XY plane that is normal (perpendicular) to two endpoints. |
| vec(end,end) | Calculates a vector from two endpoints. |
Vee1 | vec1(end,end) | Calculates a one-unit vector from two endpoints. |
To use these functions, follow these steps:
Start a command.
At the prompt where you need the function, type 'quickcalc. The QuickCalc window opens.
From the Variables list, double-click the function that you want to place in the Input box of the QuickCalc window.
Press Enter. You return to your drawing and see a pickbox cursor.
Pick the required points, most commonly by object snaps. The QuickCalc window returns, and you see an absolute coordinate in the Input box.
Click the Apply button.
Continue the command.
Note
A vector is a direction that is expressed as delta X, delta Y, delta Z. For example, using the vee function on a horizontal line that is 4 units long results in a vector direction of 4,0,0.
Tip
When you click a function, you see a tooltip giving you the full format of the function. The full formats are in the Full Function column of Table 12.3. You can create your own functions. For example, to find the midpoint between two nodes (rather than two endpoints), you would use (nod+nod)/2. You can save your functions by clicking the New Variable button at the top of the Variables section. The Variable Definition dialog box opens, where you can define and save the variable.
QuickCalc is also available in the Properties palette, where you can use it to calculate values that represent properties of objects, such as the X coordinate of the start point of a line. You can even use QuickCalc like the CHANGE command to specify a new start point for a line, using the Get Coordinate button.
To change an object's property in the Properties palette, follow these steps:
Select the object.
Display the Properties palette. (Press Ctrl+1 or choose View tab
Click any value in a white text box. (Gray boxes are not editable.)
Click the QuickCalc icon to the right of the value. QuickCalc opens with the current value in the Input box.
Delete the value and enter any mathematical expression.
Click Apply to change the object. The new value also appears in the Properties palette.
Tip
For simple calculations, you don't need to use QuickCalc. When set to 1 (the default), the CALCINPUT system variable allows you to type expressions into any text box that can take a value, including the Properties palette. Start the expression with the equal sign (=) and press Alt+Enter on your keyboard at the end of the expression. For example, you could enter =1/16+1/8 to change the thickness of an object. You can even enter =sqrt(8) to obtain the square root of 8, or enter =2^3 to obtain the cube of 2! Don't forget to press Alt+Enter after you enter the expression.
Note
The drawing used in the following exercise on using the QuickCalc command, ab12-a.dwg, is in the Drawings folder on the DVD.
STEPS: Using the QUICKCALC Command
Open
ab12-a.dwgfrom the DVD if you don't have it open from the previous exercise.Save the drawing as
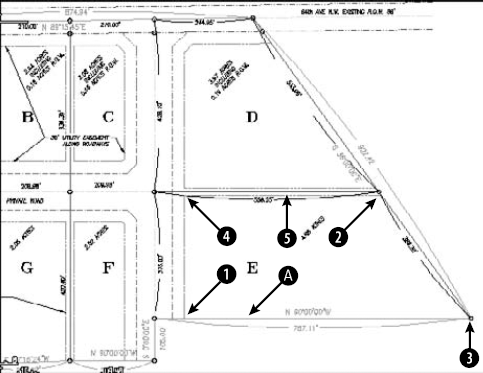
ab12-01.dwgin yourAutoCAD Biblefolder.If you did not do the previous exercise, choose Zoom from the status bar and specify a window to zoom in on the parcels labeled D and E, as shown in Figure 12.11.
In the exercise on calculating area earlier in this chapter, you calculated a total area of 306975.04, in square inches. To calculate this area in square feet, type quickcalc

Close the QuickCalc palette.
You may want to draw a line starting from the intersection of two intersecting lines, going from corner to diagonally opposite corner and ending perpendicular to the top line of the land parcel. To do this, start the LINE command. At the
Specify first point:prompt, type 'quickcalcClick the Intersection of Two Lines Defined by Four Points button. Pick the endpoints shown in Figure 12.11 at

Save your drawing.
A great deal of information is available to you in each drawing. In this chapter you read about:
Getting a general status listing
Listing system variable settings
Tracking drawing time
Getting information about individual objects by using the LIST and ID commands
Measuring objects, and calculating area and perimeters
Using the Properties palette to display all an object's properties
Dividing and measuring objects by placing point objects along them
Using AutoCAD's calculator to use calculated results as part of your command input
In the next chapter, I explain how to create and edit text.