
Most drawing jobs are not complete until you see the final result on paper. Traditionally, drawings are plotted on a plotter. However, you can also print a drawing on a regular computer printer. Many printers and plotters can handle a wide range of drawing sizes and paper types. In this chapter, I explain the process of preparing a drawing for plotting, including laying it out in paper space, more properly known as a layout. Finally, I cover the actual process of creating a plot.
When you complete your drawing, you often have some details to finish. If you didn't start with a titleblock, you may need to insert one. Even if you have a titleblock, you may need to complete some of its annotation,such as the date that you completed the drawing. If the drawing has layers that you don't want to appear on paper, you should set their layer state to Frozen, Off, or Not Plottable.
Many architectural and mechanical drawings show several views of the model. Now is the time to check that the views are pleasingly laid out, with enough space between them for dimensions and annotation. Later in this chapter, I explain how to create viewports that lay out the drawing in various views.
You may want to do a draft plot, either to check the drawing itself or to be sure that it will print out properly. Although you can preview the plot, sometimes the results are not what you want, and it pays to test the plot on inexpensive paper before plotting on expensive vellum. Draft plots for checking purposes can often be done on a printer. Some companies have wide-format inkjet printers that accept 17 × 22-inch paper and are used exclusively for check plots. Even if the final plot will be all in black, a color printer is a good choice for draft plots because you can easily check the layer scheme.
Model space refers to the mode in which you work when you draw and edit your model. Throughout this book, the discussions and exercises have assumed that you were in model space. After you've prepared your drawing for plotting, as just discussed, you can plot your drawing. See the discussion on plotting later in this chapter.
Note
You can also plot entire sheet sets. For more information, see Chapter 26. The PUBLISH command, which I cover in Chapter 28, lets you plot multiple drawings. You can output your drawing to STL format, which supports 3D printing. See Chapter 22.
Paper space is a tool for laying out a drawing. It's analogous to creating a sheet of paper at the size on which you'll plot, and placing views on the paper. You place the views by means of floating viewports. Floating viewports on a paper space layout are windows into model space, through which you see your drawing.
If you're using several views of your model, you should consider creating a paper space layout. Although paper space was designed for the needs of 3D drawings, it's often used for 2D layout as well. If you want to show views of your model at different scales, paper space is indispensable. If you use a titleblock, paper space is a good choice, because the size of the titleblock needs to be appropriate for the sheet of paper on which you will plot.
A layout provides a visual environment that lets you know what your plot will look like. By creating more than one layout for a drawing, you can create more than one plot for a single drawing. For example, you can create layouts at different scales for different sheet sizes, layouts with different layer states for contractors who need to see varying aspects of a drawing, or layouts that show different sets of views of the drawing.
You draw in model space. You use a paper space layout to lay out a drawing. When you're in paper space, you can view your drawing only through floating viewports.
By default, you see tabs for model space and each of the layouts, as shown in Figure 17.1. To display the tabs rather than the buttons on the status bar, right-click either the Model or the Layout button and choose Display Layout and Model Tabs. If you don't see the Model tab, right-click any layout tab and choose Activate Model tab. To enter a paper space layout, simply click the Layout button on the status bar. If you are using tabs, click a layout tab. By default, you see one floating viewport through which you can view your model. An example is shown in Figure 17.1. The paper space icon and the layout tab confirm that you're looking at a paper space layout.
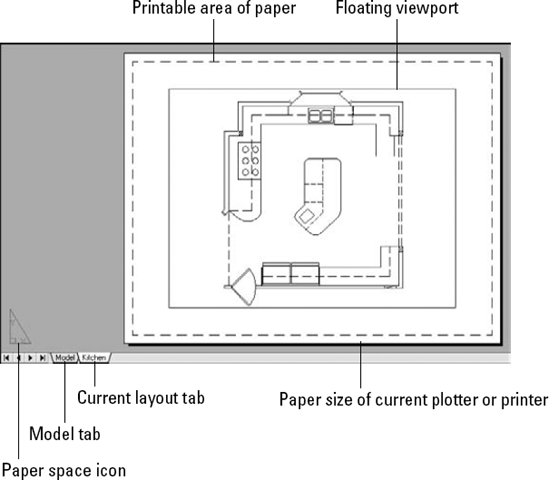
Figure 17.1. When you display a layout, the layout is automatically created, with one floating viewport through which you can see your entire drawing.
Tip
When you hover the mouse cursor over an inactive tab, you see a preview of that tab.
The Layout Wizard guides you through the process of laying out a drawing in paper space. Although you'll eventually want to lay out your drawings on your own, the Layout Wizard is one way to get started using a paper space layout.
To use the Layout Wizard, follow these steps:
Enter layoutwizard

Type a name for the layout and click Next.
The second screen asks you to choose a configured plotter. This list also includes printers. For more information on configuring a plotter or printer, see Appendix A. Click Next after you're done.
On the third screen, specify a paper size and drawing units, and then click Next.
On the next screen, specify whether you want the drawing to plot in portrait or landscape orientation. The wizard rotates a letter A on a sheet of paper so that you can see which way your drawing will plot. Then click Next.
On the Title Block screen, choose a titleblock if you want to add one. You can add it as a block, which actually inserts the titleblock (see Chapter 18), or as an external reference, or xref, which references an outside drawing of a titleblock (see Chapter 19). Choose the option you prefer in the Type section, and click Next.
Note
To add your own titleblock, first create it as a drawing (in model space) and save it in the
Templatefolder, or create your own folder for your templates. (To find the location of theTemplatefolder, choose Application Button
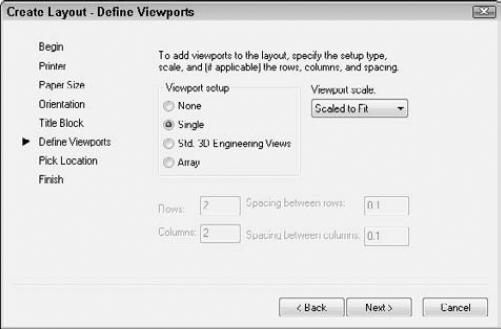
On the Define Viewports screen, shown in Figure 17.2, you choose from four viewport configuration options:
Choose None if you want to create your own floating viewports.
Choose Single to create one viewport.
Choose Std. 3D Engineering Views to create a 2 × 2 array of top, front, side, and isometric views.
Choose Array to specify how many views you want, in rows and columns.
You can also set the viewport scale. If you want to set the scale of each viewport individually, leave the default Scaled to Fit option for now. Then click Next.
Note
For more information on scales, see Chapter 5. Also see the discussion of viewport scales later in this chapter.
On the Pick Location screen, the wizard prompts you to pick two corners to define the size of the viewport configuration that you chose. If you chose more than one viewport, these two corners define the extents of all the viewports combined, not the extents of the individual viewports. Click Next.
On the last screen, click Finish to close the wizard and return to your drawing.
Figure 17.3 shows the result of completing the wizard with a 2 × 1 array of viewports. Usually, you still need to pan the model and change the scale to get the view that you want in each viewport. I discuss that process later in this chapter.
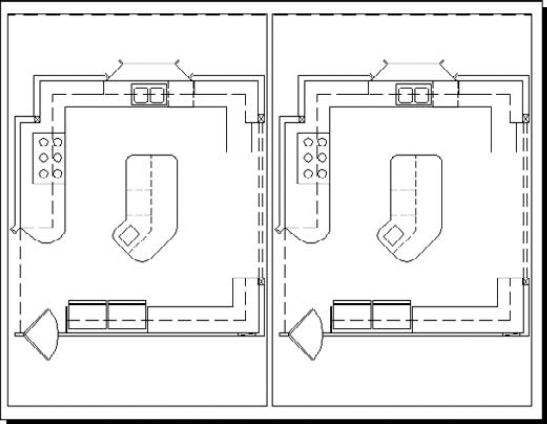
The Layout Wizard is a good way to learn, but soon you'll want to create layouts on your own. The Layout Wizard creates only the floating viewports, leaving the scaling, panning, and other tasks up to you.
You can have up to 256 layouts, including the Model tab for model space. If the tabs are not displayed, right-click the current layout button on the status bar and choose Display Layout and Model Tabs. Right-click an existing layout tab and choose from the following options on the shortcut menu:
New layout. Creates a new layout.
From template. Opens the Select File dialog box in which you can choose a
.dwg, .dxf, or.dwtfile. Click Open. You can then choose the layout or layouts that you want from the Insert Layout(s) dialog box. When you import a template, you import everything that exists on the paper space layout, including viewports, any existing text, the titleblock, and so on. (You can then get rid of anything you don't want, if necessary.)Note
If you import a layout from a drawing, any layers, linetypes, and such also come along for the ride. Use the PURGE command to get rid of anything that you don't need. See Chapter 11 for information on purging. You can also import a layout by using the DesignCenter. See Chapter 26 for details.
Delete. Deletes the selected layout. A warning dialog box appears. Click OK to delete the layout.
Rename. Allows you to edit the name of a layout in-place on the tab. Press Enter after you are done entering a new layout name.
Tip
You can also rename a layout tab by double-clicking it. Then just type the new layout name and press Enter.
Move or Copy. Opens the Move or Copy dialog box. To move a layout tab, you choose the layout tab that you want the selected tab to be to the left of. You can also choose to move it to the end. Click Create a copy to copy the selected tab. (You can then rename it.) Click OK after you're done.
Tip
You can move a layout by dragging it to a new location. You see a small arrow to indicate where it will go. This method is much easier than using the Move or Copy dialog box. To copy a layout, press Ctrl and drag to a new location. The new layout takes on the same name as the original one, but with
(2)added at the end of its name.Select All Layouts. Selects all layouts. You can then delete or publish them.
Tip
To select multiple layouts (but not necessarily all of them), press Ctrl and click each one that you want to select. By pressing Shift, you can select a range of layouts; click the first and then the last in the range.
Activate Previous Layout/Activate Model Tab. Moves you to the last layout tab that you had displayed or to the Model tab.
Page Setup Manager. Opens the Page Setup Manager, which is discussed next.
Plot. Opens the Plot dialog box, which is discussed later in this chapter.
Publish Selected Layouts. If two or more layouts are selected, you can use this item to start the PUBLISH command with the selected layouts in the list of sheets to publish. For more information on the PUBLISH command, see Chapter 28.
Import Layout as Sheet. Imports the layout to a sheet in a sheet set. (See Chapter 26 for information on sheet sets.)
Export Layout to Model. Saves the contents of the layout tab to a new drawing.
Hide Layout and Model Tabs. Hides the tabs.
Tip
To move through the tabs (Model and all the layout tabs) from left to right, press Ctrl+Page Down. To move from right to left, press Ctrl+Page Up.
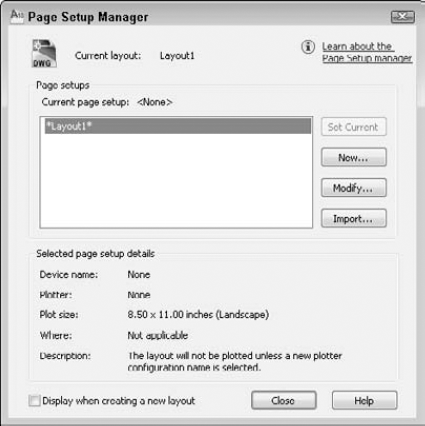
When you click a new (unused) layout tab, or choose it from the layout button (or Additional Layouts menu) on the status bar, by default you see one floating viewport. However, you can create and save page setups that store many of the settings that were explained previously in the discussion of the Layout Wizard. The value in saving page setups is that the settings are attached to the layout. If you have more than one layout, each with its own page setup, then you can quickly switch the page settings as you move from layout to layout. After you have page setups, you can manage them in the Page Setup Manager, as shown in Figure 17.4.
Note
When you check the Display When Creating a New Layout check box, the Page Setup Manager automatically appears each time you display a layout for the first time. To make it display each time if it does not appear, right-click the current paper space layout tab (you need a tab to do this) and choose Page Setup Manager; then check the check box. You can also specify whether you want the Page Setup Manager to appear when you click a new layout by choosing Application Button
To create a new page setup, click New. In the New Page Setup dialog box, enter a name for the page setup. Choose an existing page setup to start from so that you don't have to change all the settings, and click OK. The Page Setup dialog box appears, as shown in Figure 17.5.
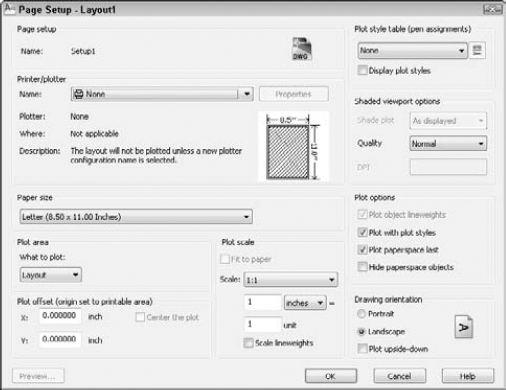
Here's how to use the Page Setup dialog box:
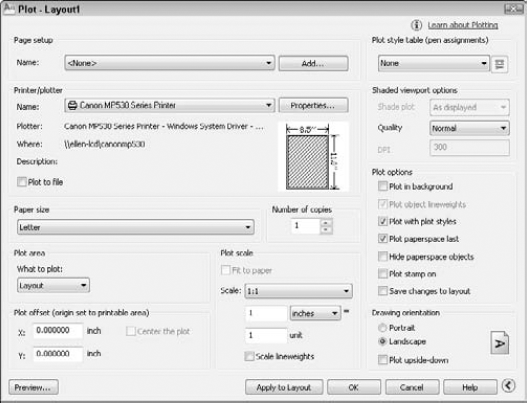
Printer/Plotter. Choose a printer or plotter from the drop-down list. For more information, see "Specifying plot settings" later in this chapter.
Paper size. Choose a paper size from the drop-down list.
Plot area. By default, the plot is set to the layout. However, you can choose to plot the current display, the drawing extents, a named view, or a window that you specify; the options available depend on whether you're on the Model tab or a layout tab.
Plot offset. You can move the plot from the lower-left corner. Specify the X and Y offset in inches. If you aren't plotting the layout, but rather some smaller area, check the Center the Plot check box to center the plot on the paper.
Plot scale. Set the scale from the drop-down list. You can also type a scale in the text boxes. Because you scale your model in your floating viewports, you usually don't have to scale the layout as well. Therefore, you typically plot a layout in paper space at 1:1. If you're using lineweights and want to scale them, check the Scale Lineweights check box.
Plot style table. Choose a plot style table if you want to use one. For more information, see the section "Working with Plot Styles" later in this chapter.
Shaded viewport options. Use this feature to determine the display of the Model tab. (To set the display of a viewport on a layout, select the viewport and make the changes in the Properties palette.) With the Model tab displayed, choose one of the Shade Plot display options: As Displayed, Wireframe, Hidden, 3D Hidden, 3D Wireframe, Conceptual, Realistic, Rendered, Draft, Low, Medium, High, or Presentation. You can also choose a quality (resolution) — Draft, Preview, Normal, Presentation, Maximum, or Custom. If you choose the Custom quality, you can specify the dots per inch (dpi). (AutoCAD only.)
Plot options. Clear the Plot Object Lineweights check box if you used lineweights but don't want the lineweights to be plotted. Clear the Plot with Plot Styles check box if you assigned plot styles to layers or objects but don't want to plot them. (Plot styles are discussed later in this chapter.) Clear the Plot Paperspace Last check box in order to plot objects drawn on the paper space layout first. Check the Hide Paperspace Objects check box to hide lines of 3D objects that you created in paper space. (Later in this chapter, I explain how to hide lines of 3D objects that were created in model space, a more common situation.)
Drawing orientation. Choose portrait or landscape. You can also choose to plot upside down. Use these settings to rotate a drawing when you plot it.
When you've completed your settings in the dialog box, click OK to return to the Page Setup Manager. You can see the new page setup in the list. To make the page setup active, click Set Current. Then click Close to return to your drawing.
Note
You can import settings saved in PCP or PC2 files from earlier releases of AutoCAD or AutoCAD LT. PCP and PC2 files contain plot settings that are similar to those that you set in the Page Setup dialog box. Click the layout that you want to use and enter pcinwizard on the command line. In the Import PCP or PC2 Settings Wizard, follow the instructions to import the PCP or PC2 file.
If necessary, create the layers that you need. If you want to insert a titleblock, create a separate layer for it. The actual viewports should also be on their own layer, because it's common to freeze that layer or set it to non-plottable, so that the borders don't show. Even if you want to plot the viewports, making them a different color from your model helps you to easily distinguish them.
Insert the titleblock. You can have a file that contains just the titleblock. You can also use a block or external reference. Putting the titleblock on your layout is common because it defines the edges of your paper and is not a real-life object. These qualities make it appropriate for paper space.
Remember that you need a floating viewport to see your model on a paper space layout. The default is one floating viewport. Floating viewports have properties that are important to understand when you're creating layouts in paper space:
Unlike tiled viewports (which I cover in Chapter 8), floating viewports are actual objects that you can erase, move, and stretch. They can — and should — be on separate layers, so that you can control the visibility of the viewport borders when desired. They don't need to take up the entire screen. You can change their size and location freely.
In paper space, the crosshairs are not limited to one floating viewport.
You can separately set the visibility of the UCS icon in each floating viewport.
You can create as many viewports as you want, but don't go overboard!
After you create floating viewports, you can switch to model space and work on your models while still on the layout. To do so, double-click inside a viewport. You do this mostly to adjust the view of the model in the viewport. In model space, floating viewports are similar to tiled viewports in that only one can be active at a time.
Whatever you draw in paper space does not affect your models; it exists only in paper space and disappears when you click the Model tab or button.
Because viewports are created on the current layer, you need to make the desired layer current. If the default viewport appears and you don't want it, select and delete it. Then to create floating viewports, choose View tab
Tip
If you have saved named views, you can immediately display them in a viewport. Click one of the viewports in the Preview pane and choose the named view from the Change View To drop-down list. At the same time, you can specify a visual style for each viewport. (I cover visual styles in Chapter 22; visual styles are available in AutoCAD only.) You can do this for each viewport that you create.
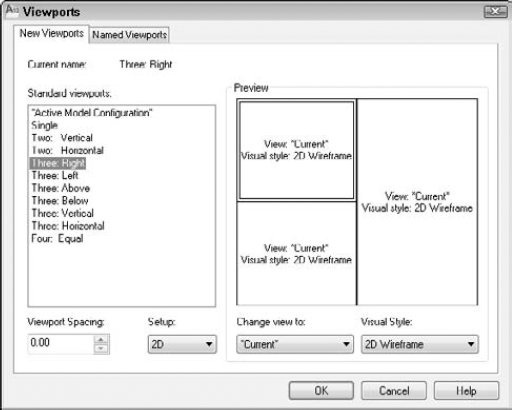
Figure 17.6. Use the Viewports dialog box to choose one of the standard configurations of floating viewports.
You can also create a polygonal viewport.
Polygonal viewports are now in AutoCAD LT. Follow these steps:

At the
Specify start point:prompt, pick a point.At the
Specify next point or [Arc/Length/Undo]:prompt, continue to specify points or right-click to choose one of the options. If you choose the Arc option, you see suboptions that are just like those you see when drawing an arc in a polyline.Press Enter to use the Close option (which appears after you've specified two or more points) to complete the viewport.
As soon as you create a viewport, you see your drawing in the new viewport.
After creating viewports, the next step is to set the view in each viewport. To do this, you need to return to model space, while still on the layout, and make a viewport active. The active viewport shows a dark border. You can do this in two ways:
Double-click inside the viewport that you want to become active.
If you have layout tabs displayed, click PAPER on the status bar. (The button then says MODEL.) Then click the viewport that you want to become active.
To help you work more easily in a viewport, you can maximize the viewport temporarily without leaving the layout. Just double-click the selected viewport's border. Another way to maximize a viewport is to right-click with the viewport border selected and choose Maximize Viewport. The viewport takes up the entire screen, and you see a red border around the edge. You can draw, edit, zoom, or pan in the view as you normally would in model space; however, zooming and panning have no effect on the viewport's view or scale. When you've finished making the desired changes, right-click and choose Minimize Viewport. The commands that maximize and minimize a viewport are VPMAX and VPMIN. While you're in a layout, you can use the following buttons on the status bar:
Tip
To cycle from viewport to viewport while in model space, press Ctrl+R. (This technique doesn't work if the viewport is maximized.)
You'll probably want to set the zoom for each viewport to exact scale. Each viewport can have its own scale, and you can set the zoom in three ways:
If you're still in paper space, select the viewport on its border. Open the Properties palette. Choose Standard Scale and choose one of the standard scales from the drop-down list that appears.
If you select the viewport, or double-click inside it to enter model space, the Viewport Scale pop-up list appears on the status bar, where you can choose a scale.
From model space, choose Zoom from the status bar or choose View tab
After you scale each viewport, you need to go back and pan until you see what you want in the viewport. If necessary, you can also change the size of the viewport itself.
If you remain in model space with a viewport active, and then zoom in or out, you change the displayed scale of the model. After you set the scale, you should lock it to avoid this problem. To lock a viewport, select the viewport's border (while in paper space) and display the Properties palette. Choose Display Locked and then choose Yes from the drop-down list. (You can also select the viewport, right-click, and choose Display Locked
Tip
You can lock and unlock any selected viewport on the status bar by using the lock icon to the left of the VP Scale drop-down list, or in the Quick Properties panel.
To adjust the viewports themselves, return to paper space by clicking MODEL on the status bar or by double-clicking anywhere outside a viewport (but in the drawing area). You cannot access your models anymore, but you can now move and resize the viewports if necessary. You can use grips to stretch and move them, or use the STRETCH and MOVE commands.
The VPCLIP command enables you to redefine the boundary of an existing viewport. You can delete the boundary of a clipped viewport and change it to a rectangular viewport or create a polygonal boundary just as you do when creating a polygonal viewport.
Note
The VPCLIP command is new for AutoCAD LT.
You can also turn viewports on and off. When a viewport is off, it doesn't display your model. Do this when the regeneration process becomes slow as a result of a large number of viewports or a complex drawing. To turn off a viewport, select it (in paper space); then right-click and choose Display Viewport Objects
The PSLTSCALE system variable controls linetype scaling in paper space viewports. By default, it is set to 1 so that the paper space scale controls the scale of any noncontinuous linetypes. This lets you have viewports of differing scales while displaying linetypes identically. When you set PSLTSCALE to 0, linetype scales are based on the drawing units where the object was created (in either model space or paper space). Linetypes are still scaled by the LTSCALE factor. When you either change PSLTSCALE or change the zoom scale in a viewport with PSLTSCALE set to 1, you need to do a regen to update the linetype scales in each viewport.
If you want, you can individually set layer visibility in floating viewports. For example, you might have some text or dimensions that appear in more than one floating viewport, but you may not want to show them more than once. Or perhaps you don't want a hatch to appear in one of the viewports. You must be in model space, so double-click in any viewport. To freeze a layer in an active viewport, click the Layer Control drop-down list in the Home tab
You can also freeze/thaw layers in new viewports; these are viewports that you haven't yet created. Choose Home tab
Note
Remember that layers have a plottable/not plottable state. Therefore, you can set certain layers to not plottable if you don't want them to appear on the plot. For more information, see Chapter 11.
You can change the properties of a layer — color, linetype, lineweight, and plot style — by viewport. For example, you could make a layer that is green in model space display as blue in one of the viewports. This feature is called layer overrides.
To set layer properties for individual viewports, follow these steps:
Display a layout and double-click the desired viewport to enter model space from that layout.
Open the Layer Properties Manager. You now see four new columns — VP Color, VP Linetype, VP Lineweight, and VP Plot Style — as shown in Figure 17.7.
To override the properties of a layer for that viewport, you use the same method as for any other property. (See Chapter 11 for a full explanation of the Layer Properties Manager and layers.) For example, to override the color, click the layer's item in the VP Color column to open the Select Color dialog box, where you can choose a new color.
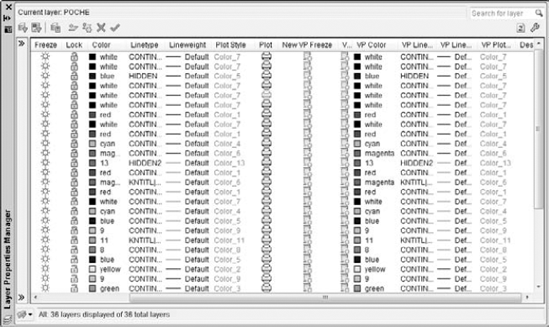
When you create a layer override, the Layer Properties Manager displays a light blue block in the column for the layer's name, the column for the property you overrode, and the VP column for that property. You see the same block for that layer in the Layer Control drop-down list in the Layers panel on the Home tab. The block only appears when the affected viewport is current. A new layer filter, Viewport Overrides, appears in the Layer Filter list, which displays only layers that have viewport overrides.
You can remove overrides in several ways, depending on whether you want to remove all of a layer's overrides and whether you want to remove overrides in all viewports (as opposed to the current one). To remove an override, open the Layer Properties Manager and do one of the following:
To remove one property override (such as Color) for a layer, right-click the layer containing the override and choose Remove Viewport Overrides For
To remove all property overrides for a layer (or all selected layers), right-click the layer and choose Remove Viewport Overrides For
To remove all property overrides, right-click any layer and choose Remove Viewport Overrides For
Setting hidden and shaded views for viewports
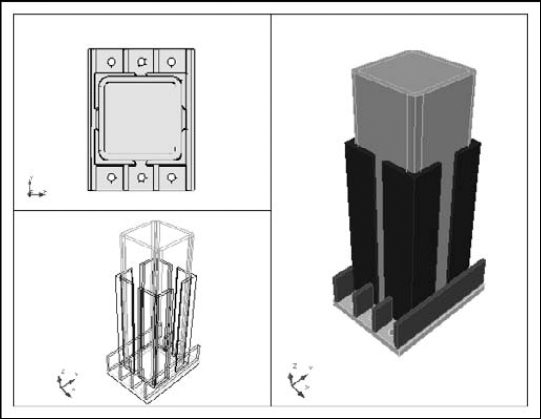
If you have a 3D drawing, you may want to hide back lines for objects in a viewport when you plot (similar to using the 3D Hidden visual style on the Model tab). This procedure lets you hide lines in one viewport but not in others. You don't see the result until you plot or display a plot preview. You can also specify shading and rendered views for each viewport, from both model space and paper space layouts, as shown in Figure 17.8.
To choose the type of shaded view, select any viewport in paper space. Right-click, and choose Shade Plot. Then choose one of the following options:
As Displayed. Plots the objects as they're currently displayed.
Wireframe. Plots the objects in wireframe display.
Hidden. Plots the objects with back lines removed.
3D Hidden. Like the Hidden option, hides the back lines (AutoCAD only).
3D Wireframe. Plots the objects in wireframe display (AutoCAD only).
Conceptual. Shades the model with flat colors on its faces (AutoCAD only).
Realistic. Shades the model with a special color palette and gradients (AutoCAD only).
Rendered. Plots objects using the default rendering settings. (See Chapter 25 for information on rendering. This option is not available in AutoCAD LT.) Express Tools (in AutoCAD only) include several commands for working with layouts:
The ALIGNSPACE command (choose Express Tools tab
The VPSYNC command (choose Express Tools tab
The VPSCALE command (choose Express Tools tab
The LAYOUTMERGE command (choose Express Tools tab
Before plotting, you may want to add notes, dimensions, and other annotations. You also need to pay attention to the scale of certain items in your viewports to make sure that they appear properly. For example, if you have one viewport at 1:1 and another at 1:4 and you show dimensions in both viewports, the dimensions will appear at different sizes in each viewport. This makes legibility difficult. Other items that may need adjustment are text, hatches, blocks, and linetypes.
You can annotate a drawing in two different ways:
You can use annotative objects, which store representations at various scales and display them according to the scale of a specific viewport. They automate the process of scaling certain types of objects in viewports at various scales. You can create annotation objects for text, Mtext, dimensions, tolerances, leaders, multileaders, hatches, blocks, and block attributes. You create these objects in model space. For example, you can display objects at 1:1 in one viewport and 1:4 in another viewport, but the text will be the same size in each viewport. You can control the display of more types of objects in this way, but the process is somewhat more complex.
Note
I discuss how to create annotative objects in the following chapters: text and Mtext in Chapter 13; dimensions, tolerances, multileaders, and leaders in Chapters 14 and 15; hatches in Chapter 16; and blocks and attributes in Chapter 18.
You can annotate in paper space, in which case you create the annotations at their desired plotting size, without scaling them. This method is fairly easy, but it doesn't allow control over drawing objects such as blocks, attributes, and hatches.
Before these methods were available, for each object, you needed to create a separate layer for each scale, calculate the appropriate size for each object, and freeze layers in the viewports where you didn't want certain objects to appear. For example, if you wanted one text object to appear at 1:1 in one viewport and another text object to appear at 1:4 in another viewport, you created them at the appropriate size on different layers. Then you froze one layer in one viewport and the other layer in the other viewport. As you can imagine, this was a complicated process.
The purpose of using annotation objects is to automate the process of scaling these objects when you display them at different scales in different viewports. To use this feature, each of the objects needs to be annotative; you add this property when you create the object or its style (such as a text style).
Follow these steps to create and use annotation objects:
For the following objects, first create an annotative style:
Mtext. Use the default Annotative text style or create an annotative text style by checking the Annotative check box in the Text Style dialog box. At the same time, you use the Paper Text Height text box to set the final height you want for your text when you plot it on paper. See Chapter 13 for details.
Dimensions. Use the default Annotative dimension style or create an annotative dimension style by checking the Annotative check box in the Create New Dimension Style dialog box or on the Fit tab of the New (or Modify) Dimension Style dialog box. See Chapter 15 for details. Note that you need an annotative text style for the text in your annotative dimensions.
Multileaders. Use the default Annotative multileader style or create an annotative multileader style by checking the Annotative check box in the Create New Multileader Style dialog box or on the Leader Structure tab of the Modify Multileader Style dialog box. See Chapter 14 for details. Note that you need an annotative text style for the text in your multileaders.
Note
You can also create annotative leaders by using the QLEADER command. You don't create a special style for the leader, but you need to use an annotative text style for its text. You also need an annotative text style for block attributes (covered in Chapter 18).
Decide which objects you will display at which scales. If you don't know this when you draw your objects, you can add scales to them later. Remember that you might have objects that you want to appear at one scale, but not at another scale; however, you might have objects that you want to appear at more than one scale. Of course, you can change the scales of your objects later. A good way to help you figure out the scales that you need is to set up your viewports before you finish drawing, including their scales.
Note

You need to assign an annotation scale to all objects that you want to be annotative. You can do so as you draw, or afterwards. To set the annotation scale as you draw, click the Annotation Scale button at the right side of the status bar to display the scale list and choose the scale you want. For example, choose 1:4 if you plan to display the object in a viewport at the 1:4 scale.
Note
In Chapter 5, I explain scales in general and how to edit the scale list. It's much easier to work with the scale list when it doesn't include scales that you don't use. You can also change the order of the list to place scales that you use most often at the top.
Create the object. The Select Annotation Scale dialog box opens the first time that you create an annotation object in your session, and requests that you choose an annotation scale. You can do so from the drop-down list in that dialog box. If you've already set the scale, just click OK. Remember that you can add and change annotation scales at any time.
Add other annotation scale to existing objects. You can do this in two ways:
If ANNOAUTOSCALE is on, to add another annotation scale to existing objects, you just choose another annotation scale by clicking the Annotation Scale button on the status bar.

Note

If you're manually adding an annotation scale, click the Add button. In the Add Scales to Object dialog box, choose the scale or scales that you want, and click OK twice to return to your drawing.
Note
The ANNOALLVISIBLE system variable determines whether you see all the scales for an object (On) or only the current scale (Off). Use the Annotation Visibility button on the status bar to the right of the Annotation Scale drop-down list. On the Model tab, turn this variable on to check that objects have the multiple annotation scales that you want them to have. On a layout, you usually want to keep this variable off, because seeing multiple scales is confusing.
The SELECTIONANNODISPLAY system variable specifies whether you see alternative sizes of an annotative object when you select it. The size of the object for the current annotative scale shows whether or not the object is selected, but when you select the object, you see all sizes if this system variable is set to 1, the default. However, objects at sizes for noncurrent scales are dimmed.
Switch to a layout and create the viewports that you need at the scales that you have chosen. Pan to get the display you want. Then lock the display, as explained earlier in this chapter.
Your annotation objects now automatically scale to match the scale of their viewport. If you don't get the results you want, you can check that the viewport scale and the annotative scale match by selecting a viewport and looking on the right side of the status bar. If they don't match, change the annotative scale from the pop-up list; your objects should now scale properly.
Tip
Annotation that applies to the entire drawing, such as titleblock text, can be, and often is, created on the paper space layout. You can change to a text layer and use the DTEXT or MTEXT command, as usual.
Sometimes you create an object in model space — perhaps some text or a logo — and want to move it to paper space, or vice versa. For example, you may want to move a text label that you inserted in model space into your titleblock, which you inserted in paper space. The CHSPACE command makes it easy to move objects from one space to the other, without worrying about scale differences.
To move an object in either direction, follow these steps:
Display a layout.
Switch to the space where the object that you want to move resides. For example, if you want to move text from model space to paper space, double-click inside the viewport containing the text to switch to model space.
Choose Home tab
Select the object that you want to move.
Make the desired viewport active and press Enter.
The command scales objects to maintain the same visual appearance. The amount of scaling depends on the scaling of the viewport. If the viewport scale is 1:1, no scaling occurs.
In Chapters 14 and 15, I discussed dimensioning in model space, but you can dimension in paper space, as well. The Trans-Spatial Dimensioning feature automatically adjusts dimensions for the scale of the viewport. These paper space dimensions are fully associative. Dimensioning in paper space has several advantages:
You don't have to worry about the size of the individual dimension components themselves, such as the text and the arrows. If you plot from paper space, you plot at 1:1 scale.
If you don't need to scale other objects (such as hatches and blocks), dimensioning in paper space is probably simpler than using the annotative feature.
You can place the dimensions outside the border of the floating viewport, which may make it easier to fit the dimensions. (On the other hand, you may find it harder to fit the dimensions if you have other viewports on the layout.)
You can easily dimension just one view of the model.
Tip
If you create dimensions in a viewport in paper space and then zoom or pan in that viewport, the objects and the dimension get out of sync. Use the DIMREGEN command on the command line to reset the dimension to match its object.
You still need to scale the size of the dimension to your viewport scale, including the text, arrows, and so on, as follows:
Open the Dimension Style Manager.
Choose the dimension style that you want to use and click Modify.
On the Fit tab, choose Scale Dimensions to Layout.
Click OK and then click Close.
When you follow this procedure, all the dimensions using the dimension style that you chose appear the same size on your final plot.
Note
Drawings created in earlier releases (before AutoCAD 2002 and AutoCAD LT 2002) do not automatically have the new associative dimensions. If necessary, change the DIMASSOC system variable's value to 2. Also, you usually need to use the DIMREASSOCIATE command to associate existing dimensions to their objects. See Chapter 14 for more information on associative dimensions.
You can create a new drawing by exporting a layout tab. All visible layout tab objects appear in model space in the new drawing. Right-click a layout tab and choose Export Layout to Model (the EXPORTLAYOUT command) to open the Export Layout to Model Space Drawing dialog box. The command creates a default filename based on the current drawing and layout names. You can change the name and location. Click Save. You can then choose to open the new drawing immediately.
After you do all the work to create a layout, you can save it as a template so that you can use it in other drawings. (The template includes all objects on the layout.) Here's how:
Type layout
At the prompt, right-click and choose Save As.
At the
Enter layout to save to template <Layout2>:prompt, press Enter to save the current layout, the name of which appears in brackets, or type the name of another layout.The Create Drawing File dialog box opens, with the
Templatefolder active. The Files of Type drop-down list shows AutoCAD (LT) Drawing Template File (*.dwt). Type a name for the drawing template and click Save.
To use the template to add a new layout in any drawing, right-click a layout tab and choose From Template, as explained earlier in this chapter.
Note
The drawings used in the following exercise on laying out a drawing in paper space, ab17-a.dwg and ab-17-a-blk.dwg, are in the Drawings folder on the DVD.
STEPS: Laying Out a Drawing in Paper Space
Open
ab17-a.dwgfrom your DVD.Save the file as
ab17-01.dwgin yourAutoCAD Biblefolder. This file already has a text style, dimension style, and multileader style that are annotative.If you do not have tabs displayed at the bottom of the drawing area, right-click the Model button on the status bar and choose Display Layout and Model Tabs. Click the Layout1 tab. Right-click the tab and choose Page Setup Manager.
Click New. In the New Page Setup Name text box, type PrinterDraft. Click OK. The Page Setup dialog box opens.
In the Paper Size section, the paper size should be set to Letter (8.50 × 11 inches). (This enables you to plot to a printer if you don't have a plotter available.) In the Shaded Viewport Options section, choose Draft from the Quality drop-down list. Make sure that your printer is listed in the Name drop-down list of the Printer/Plotter section. Click OK to return to the Page Setup Manager.
The
PrinterDraftpage setup should be highlighted. Click Set Current. Click Close.Double-click the Layout1 tab. Type 2-view and press Enter.
From Home tab
Choose Insert tab
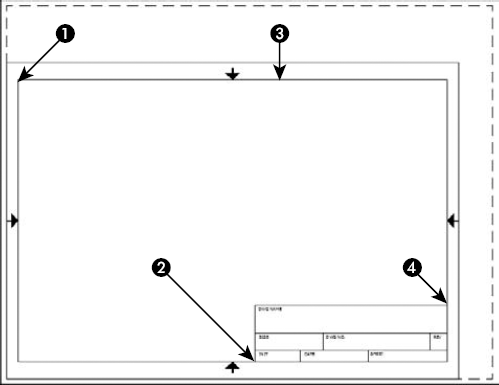
Uncheck any checked Specify On-Screen check boxes. Click OK to insert the titleblock, as shown in Figure 17.10.
Choose the
Nplayer from the Layer Control drop-down list to make it current.Choose View tab
Right-click and choose Repeat VPORTS. Again, choose Single and click OK. At the prompt, choose

Click the border of the left viewport. Press Ctrl+1 to open the Properties palette. Choose Standard Scale from the Properties palette. Click the Standard Scale drop-down arrow and choose 1:2 from the scale list. Press Esc to deselect the top-left viewport.
Select the right viewport and set its standard scale to 1:1. Deselect the right viewport.
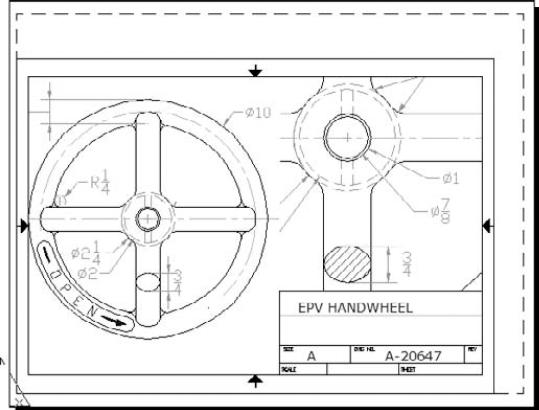
Double-click inside each viewport in turn to switch to model space, and pan until you see the view shown in Figure 17.11. It doesn't have to match exactly. Notice that the dimension text size is different in the two viewports.
Click the Model tab. Change the current layer to Hatch. Choose Home tab
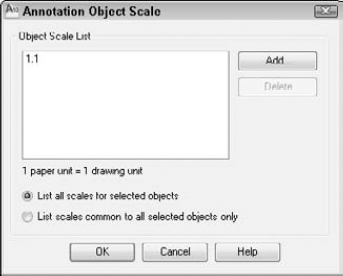
Using the Annotation Scale list on the status bar, change the current scale to 1:2. You need to add this scale to the annotative objects. Select all the dimensions, except the two diameter dimensions in the lower-right quadrant of the handwheel (which read Ø 1 and Ø 7/8). (Also don't include the multileader in the upper-right quadrant of the wheel that contains the text R3/8.) Right-click in the drawing area and choose Annotative Object Scale
Repeat Step 18 for the multileader below the handwheel. Finally, repeat Step 18 for the hatch that you just drew.
On the status bar, change the annotation scale back to 1:1. The dimensions, multileaders, and hatch return to their original sizes.
Switch to the 2-view tab. You should see that the text of the dimensions in both viewports is the same size, as is the hatch pattern. Note that the diameter dimensions in the lower-right quadrant that don't have a 2:1 annotation scale don't appear in the left-hand viewport, which has a 2:1 annotation scale. Similarly, the multileader in the upper-right quadrant (with the text R3/8) also appears only in the right-hand 1:1 viewport because it has a 1:1 annotation scale only.
Note
If you don't see these results, first select each viewport in turn, making sure that both the VP scale and the annotation scale are the same, and that the left viewport is set to 1:2 and the right viewport is set to 1:1. Also, return to model space, select the dimensions that appear incorrect, right-click them, and choose Annotative Object Scale
Double-click the right-hand viewport to enter model space from the layout with that viewport current. You'll create a layer override for the hatch. Display the Layer Properties Manager. In the VP Color column, click the HATCH row, which reads
cyan. In the Select Color dialog box that opens, choose the Red swatch. Click OK. The hatch now displays as red in the right viewport.Double-click inside the left viewport. From the Layer Control drop-down list in the Layers panel of the Home tab, click the icon in the third column (Freeze or Thaw in Current Viewport) next to the HATCH layer to freeze that layer in the viewport.
From the same Layer Control drop-down list, click the name of the DIM layer to make it current. From the Annotation tab's Dimensions panel, choose STYLE1 from the Dimension Style drop-down list. This dimension style is set to be scaled to paper space.
Double-click outside a viewport, but in the drawing area, to enter paper space. Choose Annotate tab
Click the Layer Control drop-down arrow and change the current layer to TEXT. Click the Layer Control drop-down arrow again. Click the icon in the second column (Freeze or Thaw in ALL Viewports) next to the
Nplayer to freeze the layer containing the viewport borders. Click the top of the drop-down list to close it.Choose Annotate tab
Save your drawing.
A plot style is an object property, like color, linetype, lineweight, or layer. Just as you can assign a color to an object and also to a layer, you can assign a plot style to an object and also to a layer. Because a plot style determines how an object is plotted, its function is to override the object's original properties. However, a plot style is more complex than a color or a linetype because it contains a set of properties, such as color-related properties, linetype, lineweight, and line styles. The use of plot styles is completely optional. Without plot styles, objects are simply plotted according to their properties.
You can use plot styles to create several types of plots for one drawing or layout. Plot styles also enable you to use some of the printer-like capabilities of plotters, such as screening and dithering.
Plot styles are stored in plot-style tables, which are files that you can create and edit. You generally follow these steps to use plot styles in your plots:
Create a plot-style table.
Attach a plot-style table to a layout.
Set the plot-style property for a layer or object.
Plot.
Plot styles come in two types, color-dependent and named. Before you work with plot styles, you need to choose which type you want to use:
Color-dependent plot styles, the default, are saved in color-dependent plot-style tables, which are files with a file extension of
.ctb. You assign plotting properties based on object color. The disadvantage of color-dependent plot styles is that you can't assign different properties to two objects that have the same color.Named plot styles are saved in named plot-style tables, which are files with a file extension of
.stb. Named plot styles let you assign plotting properties to objects regardless of their color. Therefore, two objects of the same color can be plotted differently.
Note
Dimensions and tables don't take full advantage of named plot styles. They support color-dependent plot styles only for their components, such as the arrows and extension lines of dimensions. Also, if you use visual styles in 3D drawings (any visual style except 2D Wireframe), plot styles are ignored. The visual style takes precedence in determining how the drawing plots. I cover visual styles in Chapter 22.
After you decide which type of plot style you want to use, you set the mode by choosing Application Button
In the same location, you can set the following:
Default plot-style table (the default is
acad.stboracadlt.stbfor named andacad.ctboracadlt.ctbfor color-dependent plot styles).Default plot style for layer 0 (the default is Normal for named plot styles and ByColor for color-dependent plot styles).
Default plot style for objects (the default is ByLayer for named plot styles and ByColor for color-dependent plot styles).
The default plot style for objects is the current plot style for new objects, and is similar in concept to the current color, linetype, lineweight, or layer for new objects. After you're done, click OK.
It is important to understand that changing the plot-style mode does not affect the current drawing. To use the new setting, you must either open a new drawing or open a drawing from a previous release that has not been saved in an AutoCAD 2000/AutoCAD LT 2000 or later format. Moreover, any template that you use to open a new drawing must be set to use named plot styles. AutoCAD and AutoCAD LT come with a template called acad -Named Plot Styles.dwt (acadlt -Named Plot Styles.dwt) that you can use, or you can create your own template. Several other templates have the words "Named Plot Styles" in their title, indicating that they include the setting for named plot styles.
Warning
If you have color-dependent plot styles for existing pre–AutoCAD 2000/AutoCAD LT 2000 drawings (and want to keep them that way) but decide to use named plot styles for new drawings, you need to avoid opening any of the existing drawings while you're in named plot-style mode. If you do, they'll be changed to named plot-style mode. Remember that pre–Release 2000 drawings don't have any plot styles — plot settings had to be according to color. You might consider setting the mode to color-dependent plot styles, creating a script file to open and save all your existing drawings as AutoCAD 2010 or AutoCAD LT 2010 drawings, and only then change the mode to named plot styles. Chapter 30 explains how to create script files.
You can convert color-dependent plot-style tables to named plot-style tables by using the CONVERTCTB command. You can then use the CONVERTPSTYLES command to convert the drawing so that it uses named plot styles. You can also use the CONVERTPSTYLES command to convert a drawing from using named plot styles to using color-dependent plot styles.
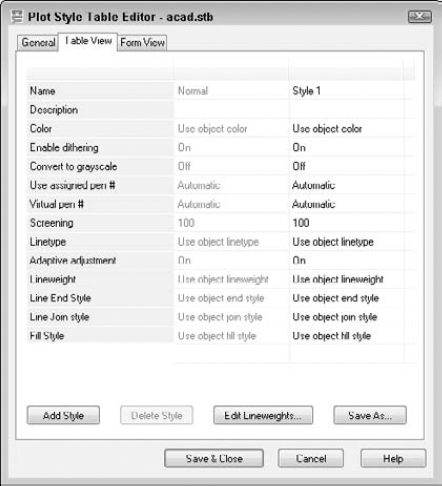
Each named plot-style table comes with a default plot style called Normal. By default, the plot style for each layer in a named plot style drawing is Normal. Figure 17.12 shows the Normal plot style, shown in a plot-style table with a Style1 that you can use to create a new plot style. The Normal plot style is grayed out because you cannot change it.
The Table View tab lists your plot styles side by side. Each plot style includes settings for the various categories that are available in a plot style.
Plot-style tables are stored in the Plot Styles folder. The default plot-style tables are acad.stb or acadlt.stb (named plot style) and acad.ctb or acadlt.ctb (color-dependent plot style).
Note
To find the location of the Plot Styles folder, choose Application Button
You can import plot configuration files (PCP and PC2 files) or the Release 14 configuration file (acadr14.cfg) to create plot-style tables or create plot-style tables from scratch.
To use plot styles, you can add a plot style to an existing plot-style table or create a new plot-style table. Each plot-style table is a separate file. To create a named plot-style table, use the Add Plot Style Table Wizard. You can access this wizard by choosing Application Button
To use the wizard, follow these steps:
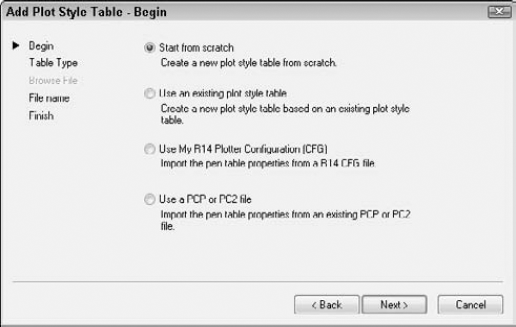
The wizard opens with an explanation of plot-style tables. Choose Next.
On the Begin screen, shown in Figure 17.13, choose the source that you want to use for the plot-style table. You can start from scratch or use an existing plot-style table. Choose Use My R14 Plotter Configuration (CFG) to use the pen assignments from the
acadr14.cfgfile. If you have a PCP (Release 12/13) or PC2 (Release 14) configuration file, you can use it to import the settings from that file into the plot-style table. Then click Next.If you choose to start from scratch or to use R14 Plotter Configuration or PCP/PC2 files, choose whether you want color-dependent or named plot styles. If you chose to use an existing file as a basis for the plot-style table, choose the file. If you chose to use a CFG file, you must also specify the plotter, because the CFG file can contain information for more than one plotter. Click Next.
On the File Name screen, type a name for the plot-style table file. Click Next.
On the Finish screen, an option labeled
Use this plot style table for new and pre-AutoCAD 2010 drawingsmay be available. If it is, then check this option to attach the plot-style table to all new drawings by default. You don't have to use the plot styles, but they will be available. Clear the option if you don't want to attach this plot-style table to new drawings by default. You can also click Plot Style Table Editor to edit plot styles immediately. You can edit plot styles at any time, as explained next. Click Finish.
After you create a plot-style table, you can edit it by adding, naming, and deleting its plot styles (for named plot-style tables only) and, of course, creating the settings that you want for the plot styles. To open the Plot Style Table Editor, do one of the following:
Choose Plot Style Table Editor from the Finish screen of the Add Plot Style Table Wizard.
Choose Application Button
From the Page Setup dialog box (discussed earlier in this chapter) or the Plot dialog box (discussed later in this chapter), choose the named plot-style table that you want to edit from the Plot Style Table drop-down list, and click Edit.
From the Select Plot Style dialog box (accessed from the Layer Properties Manager after you click the Plot Style column), choose Editor.
The Plot Style Table Editor's Table View tab was shown in Figure 17.12. The Form View tab is shown in Figure 17.14. You can edit styles by using either view tab. The Form View tab focuses on one style at a time and provides better visual confirmation of some of the choices. The Table View tab lets you compare your style to existing styles as you work.
A new Plot Style Table includes one default style, Normal. To add a style, click Add Style. Then click the style name and type a more descriptive name for the style.
Warning
You can't rename a plot style that is currently assigned to an object or layer, so it's best to name it when you create it. You can't change the names of styles in a color-dependent plot-style table.
Each plot style has a description area that you can use to provide a more detailed description of the plot style. For example, you could summarize a plot style as "color black & no lineweight."
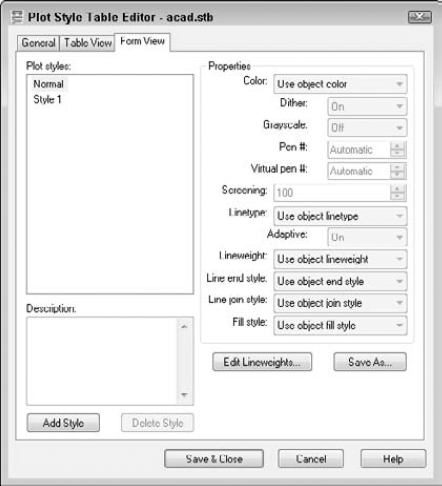
Now go through each of the properties and make any changes that you want. In Table view, you need to click the property in the Plot Styles column for a drop-down list to appear. The properties are as follows:
Color. You can specify a color other than the default, which is Object Color. For example, you might want to create a plot style that plots everything in black. Choose Select Color and define a color in the Select Color dialog box. (See Chapter 11 for an explanation of this dialog box.)
Dither. Dithering uses dot patterns to approximate a greater range of colors. Not all plotters support dithering. Dithering can make thin lines and dim colors look unclear.
Grayscale. Converts objects to grayscale, if supported by the plotter. You could use grayscale to de-emphasize certain layers or to print a draft plot on a black-and-white laser printer.
Pen # and Virtual Pen #. These settings apply to pen plotters (a Virtual Pen # applies to non-pen plotters that simulate pen plotters) and specify the pen for the object that is assigned the plot style.
Screening. Specifies the amount of ink used for a color. The range is from 0 (no ink; that is, white) to 100 (full intensity of the color). Some plotters, such as pen plotters, do not support screening. You could use a 50 percent screen to de-emphasize certain layers, such as those containing proposed changes, or to save ink.
Linetype. You can specify a linetype other than the default, Object Linetype, to override the object's linetype when you plot. For example, you might want to have the option to plot certain objects that are not yet approved in a dashed or dotted linetype.
Adaptive. Choose On to adapt the scale of a linetype to complete the linetype pattern on the object. Choose Off if maintaining the proper linetype scale is essential.
Lineweight. You can specify a lineweight other than the default, Object Lineweight.
Line End Style. When you use lineweights, you need to specify how you want to end lines. You can choose from Butt, Square, Round, and Diamond. The default is Object End Style.
Line Join Style. Specifies how objects with lineweights are joined. The choices are Miter, Bevel, Round, and Diamond. The default is Object Join Style.
Fill Style. You can choose from Solid, Checkerboard, Crosshatch, Diamonds, Horizontal Bars, Slant Left, Slant Right, Square Dots, and Vertical Bar. The default is Object Fill Style.
To delete a style, select it and click Delete Style. In Table view, click a style's gray column head to select it.
After you're done, click the Save & Close button.
As soon as you have your plot-style table and the plot styles that you want, you can start using the plot styles. The first step is to attach the table to a layout (including model space). Remember that you can attach different plot-style tables to different layouts (or the Model tab).
To attach a plot-style table to a layout or the Model tab, display the tabs if necessary (right-click the Model or Layout button on the status bar and choose Display Model and Layout tabs), and follow these steps:
Choose the layout or Model tab.
Right-click the tab and choose Page Setup Manager.
Choose a page setup and click Modify (or click New and create a new one).
In the Plot Style Table section of the Page Setup dialog box, choose a plot-style table from the Plot Style Table drop-down list.
If you're on the Model tab, choose Yes or No to the question asking whether you want to apply the plot-style table to the Model tab only or to all layouts. If you're on a layout tab, check the Display Plot Styles check box to see the result of the plot styles in your drawing.
Click OK. Then click Close to return to your drawing.
To see the result, you still need to attach a plot style to a layer or object, as I explain in the next section.
To use a plot style, you need to assign it to a layer or an object. The plot style is only applied if the plot style is first defined in the plot-style table that you've assigned to a layout (or Model tab).
To set the plot style for a layer, follow these steps:
Display the layout tab that you want to use, and open the Layer Properties Manager.
Choose the layer whose plot style you want to change, and click the Plot Style column to open the Select Plot Style dialog box.
Choose the plot-style table from the Active Plot Style Table list at the bottom of the dialog box.
Choose a plot style from the Plot Styles list.
Click OK to return to your drawing. If you are using the Layer Properties Manager dialog box, click OK again.
If you checked Display Plot Styles in the Page Setup dialog box, as explained in thepreceding section, you should see the result of the plot style. If not, type regenall
To set the plot style for an object, select the object and display the Properties palette (Ctrl+1). Choose the Plot Style item, and choose a plot style from the drop-down list. You can attach a plot style to a viewport (which is an object), but the plot style doesn't affect the objects in the viewport.
You can view the effects of plot styles in two ways:
To display plot styles in your drawing all the time, display the layout for which you want to view the plot style. Right-click the layout's tab and choose Page Setup Manager. Then select the page setup associated with the layout and click Modify. In the Page Setup dialog box, check Display Plot Styles in the Plot Style Table section. Click OK and then click Close to return to the drawing window. (You may have to use REGENALL to see the result.)
You can also see the effects of plot styles in a preview of your plot. Choose Plot from the Quick Access toolbar and click Preview.
Note
The drawing used in the following exercise on creating and applying a plot style, ab17-b.dwg, is in the Drawings folder on the DVD.
STEPS: Creating and Applying a Plot Style
With any drawing open, choose Application Button
Click Use Named Plot Styles (unless that is the current setting) and click OK twice.
Open
ab17-b.dwgfrom your DVD.Save the file as
ab17-02.dwgin yourAutoCAD Biblefolder.Choose Application Button
In the Begin screen, choose Start from Scratch and click Next. In the next screen, choose Named Plot Style Table (it's probably already selected) and click Next. In the File Name screen, type ab17-02 and click Next.
In the Finish screen, click Finish. (Don't check Use for New and Pre-AutoCAD 2010 Drawings, because this is just an exercise.)
Return to the Plot Styles window, which should still be open on the Windows task bar. (If not, choose Application Button
In the Description box of the General tab, type AutoCAD Bible Plot Style Table.
Click the Table View tab. Click the Add Style button. Click the name
Style1. Type Black Color and press Enter.Click the Color row under the Black Color column, and choose Black from the drop-down list. Click Save & Close. Close the
Plot Stylesfolder window.If you don't have Model and layout tabs displayed, right-click the Model or Layout button on the status bar and choose Display Layout and Model Tabs. Select Layout1, right-click it, and then choose Page Setup Manager from the shortcut menu.
In the Page Setup Manager, choose New. In the New Page Setup dialog box, enter AB 2010 and click OK.
In the Page Setup dialog box, make sure that your printer or plotter is listed in the Printer/Plotter section. Then choose
ab17-02.stbfrom the Plot Style Table drop-down list. Check the Display Plot Styles check box and click OK. SelectAB 2010and click Set Current. Click Close. This assigns the plot-style table to Layout1.Choose Home tab
Type regenall
Click PAPER on the status bar to switch to model space.
Select the bottom horizontal line of the sink cabinet.
Open the Properties palette (Ctrl+1). In the Properties palette, click Plot Style. From the drop-down list to the right, choose Black Color.
Press Esc so that the object is no longer highlighted. The line appears as black.
Choose Application Button
Save your drawing.
Note
The plot style that you created, ab17-02.stb, is in the Results folder on the DVD.
After you lay out your drawing, you're ready to plot it. Plotting outputs your drawing onto paper (or perhaps vellum or some other medium). The first step is to check the plotter or printer. It should be on, connected to your computer, and have the appropriate paper in it.
Note
For more information on configuring plotters, see Appendix A. For information on plotting drawing sets, see Chapter 26. I cover plotting electronically to a DWF file in Chapter 28.
Note
You can hide the right side of the Plot dialog box if you don't need the features there. Click the arrow at the lower-right corner of the dialog box. Click the same arrow to expand the dialog box, if necessary.
If you set the layout settings in the Page Setup dialog box as current, those settings were saved with the tab that was current at the time. You can usually just click OK in the Plot dialog box and plot immediately. Plot settings are saved in your drawing.
If you saved a page setup, you can choose it from the drop-down list in the Page Setup section of the dialog box. See the discussion of the Page Setup dialog box earlier in this chapter for details.
To select a plotter or printer, choose from the drop-down list in the Printer/Plotter section of the dialog box. A plotter must be either a Windows system printer or a configured plotter. To add a system printer in Windows, choose Start
Tip
To avoid inadvertently plotting to a Windows system printer when you should be plotting to a plotter, you can hide the display of Windows system printers in the Plot and Page Setup dialog boxes. Because these printers won't appear on the list of plotters, you can't plot to them. To hide system printers, choose Application Button
To choose how many copies you want to plot, change the number in the Number of Copies text box.
Check the Plot to File check box to create a plot file rather than a paper plot. When you click OK, the Browse for Plot File dialog box opens so that you can choose a name and location. Click Save.
If you want to use a plot-style table, check that it appears in the Plot Style Table drop-down list, which is in the extended portion of the dialog box, on the right. Also make sure that the Plot with Plot Styles check box is checked in the Plot Options section. In the same extended area, you can set shading options. I discuss these options in Chapter 22, because they are generally used for 3D drawings. From the Quality drop-down list, you can choose a plot quality, such as Draft, Normal, or Presentation. You can set the orientation (Portrait or Landscape) in the Drawing Orientation section.
You can merge overlapping objects so that the same area is not printed more than once. To set the Merge Overlapping property:
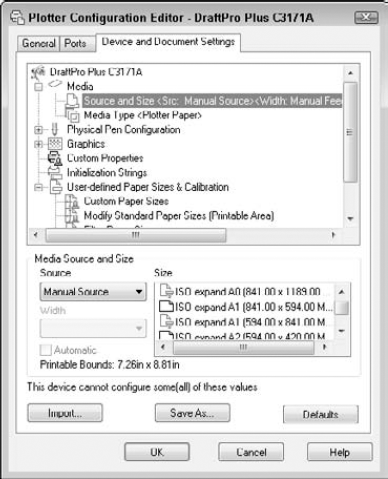
Click Properties in the Printer/Plotter section of the Plot dialog box.
In the Plotter Configuration Editor that opens, display the Device and Document Settings tab. Click the plus sign (+) next to Graphics. If you see Merge Control in the Graphics list that opens, you can use this feature on your printer or plotter. (For more information about the Plotter Configuration Editor, see the sidebar "Configuring your plotter.")
Click Merge Control. In the Merge Control area that is displayed, choose either Lines Overwrite or Lines Merge, and click OK.
You then have the choice of applying the change to the current plot only or making the change permanent by editing the PC3 file that contains the parameters for your plotter or printer. Choose one of the options and click OK.
You should preview your drawing before you plot. Click the Preview button in the Plot dialog box to see exactly how your drawing will plot. You can also choose Output tab
I cover previewing a plot last because it should be the last step before you actually plot. However, it can also be the first step to help you to determine the settings that you need.
The PLOTSTAMP command places text in a specified corner of the plot, such as the drawing name, layout name, date and time, and so on. To create a plot stamp, enter -plotstamp on the command line. Use the options to specify what you want to appear, and use the On and Off options to turn the stamp on and off. You can enter plotstamp to set the plotstamp in a dialog box, which is easier; however, you should then look at the Plot Options section of the extended Plot dialog box to make sure that the plot stamp is on ( the Plot Stamp On check box should be checked. Click the Advanced button in the Plot Stamp dialog box to specify the location, offset, and text properties of the plot stamp. (You can use fields to add information about the drawing; for more information, see Chapter 13.)
Note
Stmplot stamps a drawing with its name and location, your name, the date, and the time, and starts the PLOT command. Look in SoftwareChap17Stmplot (AutoCAD only).
Configuring your plotter
Most printers and plotters have settings that you can control from within AutoCAD or AutoCAD LT. You can also control how information about the drawing is sent to the printer or plotter. Configuring a plotter usually provides you with more options than if you choose the default Windows system printer settings. The settings that configure how your printer or plotter functions are in the Plotter Configuration Editor, as shown here.
You can filter out unused paper sizes by using the Plotter Configuration Editor. However, at the end of the process, you can opt to apply the change only to the current plot. Follow these steps:
On the Device and Document Settings tab, choose Filter Paper Sizes.
In the list of paper sizes, uncheck any sizes that you don't want to display, and click OK.
In the Changes to a Printer Configuration File dialog box, choose to apply the changes only to the current plot or to the file. When you apply the changes to the file, they are permanent until you edit the printer configuration file again.
Click OK.
To start the plotting process, simply click OK in the Plot dialog box.
You can plot in the background, and continue to work while your drawing is plotting. By default, background plotting is off. To turn it on, choose Application Button
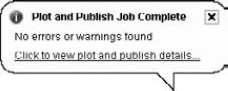
When the plot is finished, a notification bubble appears at the lower-right corner of your screen, as shown in Figure 17.16. You can click the link to view the Plot and Publish Details.
If you view the Plot and Publish Details, you see a report like the one shown in Figure 17.17. You can see details for all plots that you did in the current session of AutoCAD or AutoCAD LT.
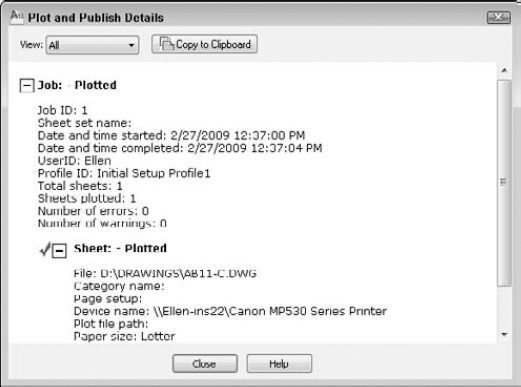
Figure 17.17. The Plot and Publish Details report tells you what happened when you plotted your drawings.
If you need to plot large numbers of drawings or multiple layouts, use the PUBLISH command, which I cover in Chapter 28.
In this chapter, you learned how to lay out and plot a drawing. You discovered how to:
Lay out a drawing in model space
Use a paper space layout
Create layouts, using the Layout Wizard and using the commands individually
Use annotative objects in a viewport
Add text and dimensions in paper space
Use the Page Setup dialog box to specify layout settings
Create plot-style tables and apply plot styles
Plot a drawing
This chapter ends Part II, "Drawing in Two Dimensions." Part III, "Working with Data," explains how to integrate your drawing with data about your objects. The next chapter covers blocks and attributes.