
CHAPTER 12
TED Spreads: An Update
Chapter 11 reproduces the research note:
• Measuring and Trading Term TED Spreads (1995)
Since this note was written, we have tracked the values of 1-year, 2-year, and 5-year TED spreads. We report time series of these spreads in Carr Futures “Daily Zero to Ten” report, shown earlier on page four of Exhibit 10.1.
We also developed a special report, “TED Spreads,” that provides two key insights into the structure of TED spreads:
• Term structure of TED spreads
• Comparison of forward and spot values of the TED spread
We have reproduced a copy of the “TED Spreads” report in Exhibits 12.1 and 12.2 as of the close on September 10, 2002. Exhibit 12.1 shows the values of TED spreads for original issue 2-year Treasury notes, which are listed in order of increasing time to maturity. You can see in this report, for example, that the TED spread for the 2-1/8s of 8/31/04 was 37.51 basis points (measured in quarterly money market basis points). In contrast, the 3-5/8s of 8/31/03, which were one year closer to maturity, traded at a spread of 21.13 basis points. This gives insight into the term structure of the TED spread.
EXHIBIT 12.1
2-Year Note TED Spreads
Plus Forward TEDs to September 18, 2002
September 10, 2002
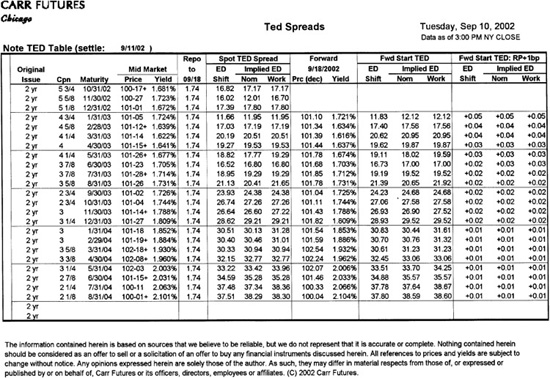
Early on in our work with traders, we learned about the importance of reckoning the forward values of TED spreads so that we could understand why trades made or lost money. The structure of the report shown in Exhibit 12.2 stems from the insight that forward values are break-even values. In this example, we calculated the forward prices of all the notes shown in the table as of December 18, 2002, using a term repo rate of 1.68 percent. Using these forward prices for the notes plus the Eurodollar futures rates beginning with the Dec ′02 contract, we calculated forward starting TEDs for all of the issues.
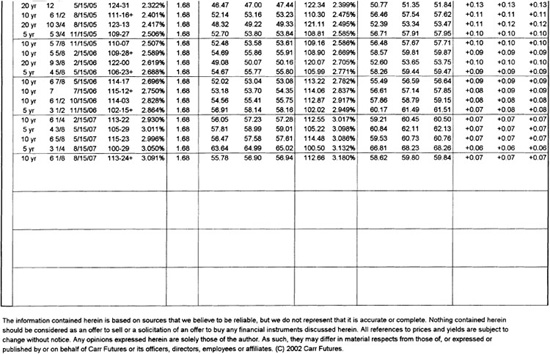
EXHIBIT 12.2
TED Spreads
Plus Forward TEDs to December 18, 2002
September 10, 2002
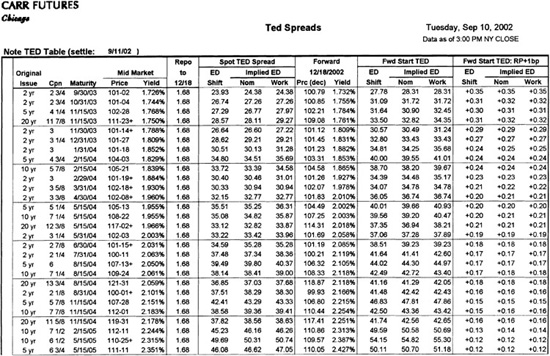
These forward-starting TEDs can be used in various ways. For example, they represent the spread values at which a trade initiated on September 10, 2002, would break even if the Treasury leg of the trade were financed at the term repo rate shown in the report.
They can also be used to assess possible convergence trades. For example, the December 18 forward-starting TED for the 2-1/8s of 8/31/04 was 41.48 basis points assuming a term repo rate of 1.68 percent. The spot TED spread for the 3-1/4s of 5/31/04 was 33.22 basis points. If one reasons that the 2-1/8s in December will have the same remaining time to maturity that the 3-1/4s had on September 10 and if one assumes that the term structure of spot TED spreads will remain unchanged, then one could sell the forward TED spread of the 2-1/8s and look for 8.26 [= 41.48 − 33.22] basis points of convergence. And the trader knows that the spot TED spread of a Treasury note that has 1-3/4s years to maturity can widen 8.26 basis points and still break even.
The forward spread calculations are sensitive to the term repo assumption. The lower is the term repo rate, the lower is the forward price of the note and the higher is its forward yield. If a note is on special in the term repo market at a rate lower than the general collateral rates shown in the report, the forward TED for that note would be smaller than the value shown. To adjust for this, the report shows how sensitive each forward TED spread is to changes in the assumed term repo rate. For example, reducing the term repo rate for the 2-1/8s by 10 basis points would decrease the forward starting TED by 1.6 [= −10 × 0.16] basis points.