CHAPTER 15
Opportunities in the S&P 500 Calendar Roll
SYNOPSIS
Anyone who uses S&P 500 futures to maintain a standing long or short position in the equity market must face the problem of when to roll out of the expiring contract month and into a deferred contract month. If futures were always fairly priced, the roll would hardly be an issue. As it is, however, the evidence suggests that one can improve a portfolio’s performance by choosing the best time to do the roll.
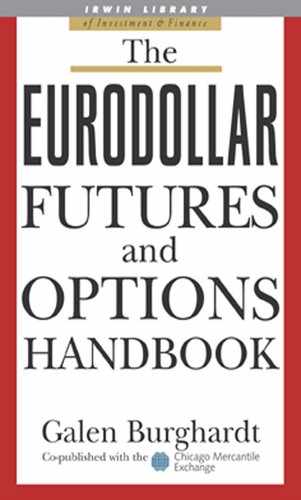
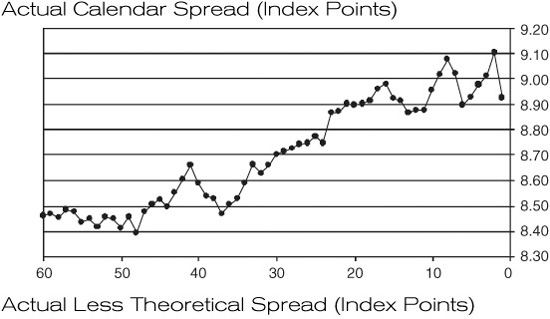
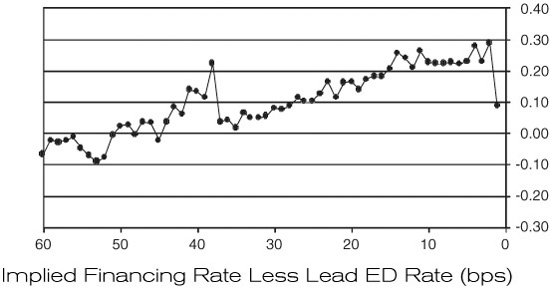
Exhibit 15.1 shows three measures of the value of the spread—the spread itself, the actual spread less the theoretical spread, and the implied financing rate less the lead Eurodollar rate—against business days remaining to expiration of the lead contract. The top panel of Exhibit 15.1 shows that the spread between the deferred contract price and the lead contract price has, over the past 3 years, tended to widen as the lead contract approaches expiration. The two lower panels show, in different ways, that the spread has become overvalued in the last days of the expiring contract’s life.
EXHIBIT 15.1
Average S&P 500 Futures Calendar Spreads (First Deferred – Lead) versus Business Days to Lead Contract Expiry 1Q 1996 through 4Q 1998
Save 15 Basis Points per Year on the Roll
This increasing richness of the spread as expiration approaches suggests that anyone who maintains a standing long position in S&P 500 futures should undertake the roll as early as possible. In contrast, anyone who maintains a standing short position should wait as long as possible.
The results in Exhibit 15.1 suggest that one could save as much as 15 basis points annualized by timing the roll correctly. On a $1 billion position, this would amount to $1.5 million a year, which makes the problem worth tackling.
Eliminate Interest Rate Risk in the Roll
We also find that much of the risk in the calendar roll comes from changes in short-term money market rates. At the current level of futures prices, a 10-basis-point change in the lead Eurodollar futures rate produces a 0.33-point change in the value of the calendar spread. On a $1 billion position, such a change in rates could produce a gain or loss of about $250 thousand, which may also be worth dealing with by buying or selling an appropriate number of Eurodollar futures.
Earn Superior Money Market Returns
For cash managers, the systematic richness in the calendar spread as the lead contract approaches expiration affords an opportunity to earn above-LIBOR money market returns with comparatively little risk. In particular, if a money manager were to combine a long stock position with a short deferred S&P 500 futures position just before the expiration of the nearby or lead contract, such a position would promise to yield as much as 15 basis points over LIBOR.
THE VALUE OF THE CALENDAR SPREAD
The relationship between the spot value of the S&P 500 index and any futures price is:
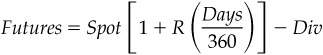
R is an appropriate money market interest rate
Days is days between the settlement date for a spot transaction in equities and futures expiration
Div, if handled correctly, is the forward value of expected dividends (that is, dividends plus interest earned on dividends) during the period
A similar expression describes the relationship between two futures prices:
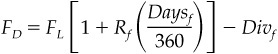
where
FD is the deferred contract price
FL is the lead contract price
Rf is the forward money market rate
Daysf is days between contract expirations
Divf is the expected forward value of dividends to be received during the period between contract expirations
Fair Value of the Spread
Armed with this relationship, the value of the spread between two futures prices can be written as:
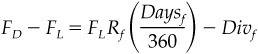
which shows that the value of the spread depends on the level of the lead futures price, the forward financing rate, days in the period, and the value of forward dividends. If you know the forward financing rate and have a solid expectation about the value of forward dividends, you can use this expression to calculate the fair value of the futures spread. The difference between the market value of the spread and the fair value of the spread would then be a measure of richness or cheapness in the spread.
Implied Financing Rate
Another way to look at things is to calculate the financing rate implied by two futures prices. The implied financing rate is:
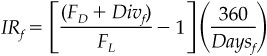
The difference between this implied financing rate and the rate that one believes to be the relevant financing rate is another way of judging the richness or cheapness of the spread. If the implied financing rate is higher than the relevant market rate, for example, the deferred contract will be rich relative to the lead contract.
Exhibit 15.2 provides a history of the difference between the implied financing rate and the value of the rate implied by the corresponding Eurodollar futures contract. That is, if the implied rate is calculated for the June and September futures contracts, the rate implied by the June Eurodollar futures contract is used for purposes of comparison. The Eurodollar contract expires on the Monday before the third Wednesday of the contract month, while the S&P 500 futures contract expires on the third Thursday (for cash settlement on the third Friday) of the contract month. Thus, the overlap in days is not perfect, but is quite good enough for these purposes.
EXHIBIT 15.2
Implied Financing Rate Less Lead ED Rate 1988–1998
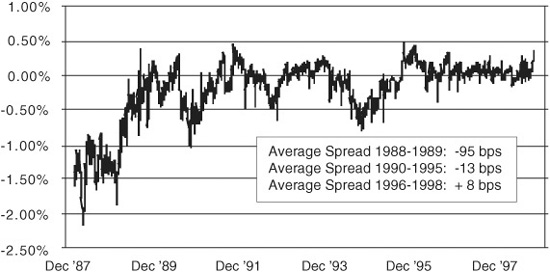
The history of this relationship is worth noting. In the late 1980s, the implied financing rate traded substantially below the corresponding Eurodollar futures rate. Then, throughout the early 1990s, the implied rate traded around but generally below the futures rate. During the past few years, though, the implied financing rate has traded in a fairly narrow range just above the Eurodollar futures rate.
HOW THE CALENDAR SPREAD HAS BEHAVED
Over the past 3 years (1996 through 1998), the average value of the calendar spread has tended to widen during the 3 months leading up to the expiration of the lead futures contract. As shown in the upper panel of Exhibit 15.1, the value of the spread increased from 8.40 to 9.00 on average during these months. By itself, the value of the spread tells you nothing about richness or cheapness. This experience could have been the result of increasing futures prices or increasing interest rates.
The lower two panels of Exhibit 15.1 show, however, that the tendency of the spread to increase reflects a tendency for the contract to become rich as the lead contract approaches expiration. In the middle panel, for example, we see that when the lead contract has about 3 months (or 60 business days) to expiration, the calendar spread is just about fairly priced. The difference between the market value of the spread and the theoretical value of the spread (calculated using a financing rate equal to the rate implied by the lead Eurodollar futures contract) is about zero. Then, as time passes, the difference between market and theoretical increases until it trades between 0.20 and 0.30 index points during the month before the lead contract expires.
The bottom panel, which shows the difference between the implied financing rate in the spread and the market financing rate (again, the rate implied by the lead Eurodollar futures contract), provides a different way of seeing exactly the same thing. With 3 months to expiration of the lead contract, the implied and market rates are nearly identical. Then, as the spread ages, the implied financing rate rises relative to the market rate until the difference is in the neighborhood of 12 to 16 basis points.
In practice, this increasing richness suggests that anyone who maintains a standing long position in S&P 500 futures should strive to roll into the deferred contract month as early as possible. Anyone who maintains a standing short position, on the other hand, should wait as long as possible to do the roll.
The increasing richness of the spread also produces opportunities for those who manage short-term money market portfolios. Because we are using Eurodollar futures to establish the fair value of the spread, the evidence in the bottom panels of Exhibit 15.1 suggests that a money manager could earn LIBOR plus 12 to 16 basis points by selling the rich deferred contract against a long position in an S&P 500 equity portfolio.
WHAT IS YOUR EXPOSURE TO INTEREST RATES?
Because the fair value of the spread is simply the forward cost of financing less the forward value of expected dividends, most of the day-to-day variability in the spread will be explained either by changes in the level of the lead futures price or in the relevant financing rate. To get an idea of your exposure to a change in the interest rate, consider this example.
At the close of business on Tuesday, June 1, 1999, the June ′99 S&P 500 futures contract closed at a price of 1291.50. At this value, given 91 days between the expirations of the June and September contracts, the effect of a 10 basis point change in the financing rate would be worth 0.33 futures price points [= 1291.50 × 0.0010 × (91/360)], which would be worth about $82.50 [= 0.33 × $250]. The same change in rates would be worth $250 for the June ′99 Eurodollar futures contract.
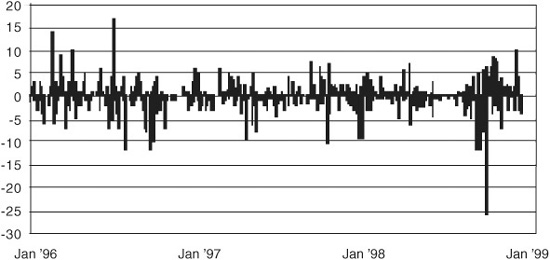
The history of daily changes in Eurodollar rates shown in Exhibit 15.3 helps put this source of risk in perspective. The standard deviation of daily rate changes over the past 3 years has been about 2.8 basis points, which would translate into a change in the spread of 0.09 price points. The history of daily rate changes is dotted with some fairly large moves, however. On several days the change was as much as 10 basis points, and on at least one occasion the rate fell 26 basis points on a single day.
EXHIBIT 15.3
Daily Changes in the Lead ED Futures Rate
Handling Rate Exposure in the Roll
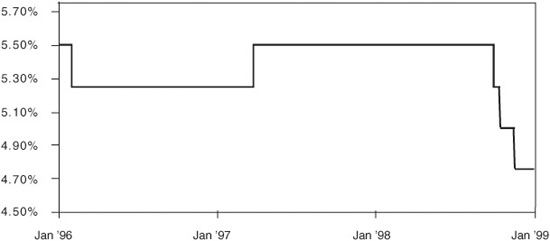
Perhaps the single most important determinant of the lead Eurodollar futures rate is the market’s expectations about where the Fed will set its target for overnight Fed funds. As shown in Exhibit 15.4, the Fed changes its target rate in discreet jumps. The market’s expectations about changes in the target rate change every day and are reflected in the spread at which LIBOR trades over the target funds rate.
EXHIBIT 15.4
Target Fed Funds Rate
The typical spread, as shown in Exhibit 15.5, is about 24 basis points. The spread is wider if the market expects a rate increase and is narrower if the market expects a rate decrease.
EXHIBIT 15.5
Lead ED Futures Rate Less Target Fed Funds Rate (bps)
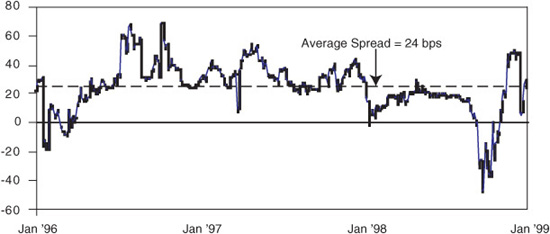
At the close on Tuesday, June 1, the June ′99 Eurodollar rate was 5.1375 percent, which was 38.75 basis points over the Fed’s target overnight Fed funds rate of 4.75 percent and about 14 basis points over the normal spread. At this spread, one can infer that the market’s guess about the probability of a 25-basis-point rate increase at the June 30 FOMC meeting is slightly greater than half—that is, about 14 bps/25 bps.
Consider now the problem faced by a portfolio manager who must roll a long S&P 500 futures position from the June to the September contract. If anything caused the market to think that a 25-basis-point rate increase would be a sure thing, the June Eurodollar rate likely would increase by about 10 basis points and the calendar spread would increase by 0.33 price points. If this happened before doing the roll, the portfolio manager would miss out on this increase.
On the other hand, if the Fed made it plain that there would be no rate increase at its June 30 meeting, the June Eurodollar rate could easily fall by 10 basis points (or more), in which case the value of the calendar spread would fall by 0.33 price points. If this happened after doing the roll, the portfolio manager would lose this much from having rolled too early.
The timing of the roll, therefore, is in large part a bet on interest rates. A portfolio manager who has a superior understanding of interest rates can outperform the S&P 500 by handling this bet well. At the same time, most equity portfolio managers are not paid to take interest rate risk and would prefer to take this kind of risk out of the equation.
Hedging against Interest Rate Risk
The easiest way to hedge against interest rate risk in the calendar spread is to combine the roll with a Eurodollar hedge. In this example, the portfolio manager who would like to wait as long as possible to roll a long position could hedge against the possibility of a rate increase by selling the appropriate number of lead Eurodollar futures. By the same token, the portfolio manager who wants to do the roll as early as possible could buy Eurodollar futures to protect against the possibility of a fall in the interest rate. In general, the correct number of Eurodollar futures contracts is:
At the current level of futures prices, this is about 0.33 Eurodollar contracts per S&P 500 contract.
CASH MANAGEMENT AND PORTFOLIO REPLICATION
As a general rule, when one combines a money market investment with a long futures position to create a portfolio that will replicate a real asset, the term of the money market investment should correspond as closely as possible to the expiration of the associated futures contract.
Timing the roll poses a challenge for cash management, then, because you may want to roll out of one contract month and into the next before the lead contract expires. If you have matched the maturity of your money market investment to the lead contract’s expiration, you have two choices for handling the cash-management problem. The first would be to sell the asset you have and replace it with one whose maturity matches the expiration of your new, longer-dated futures contract.
If the secondary market for your money market asset is illiquid, however, you have another choice, and that is to buy the lead Eurodollar futures contract. This long Eurodollar futures position will fill in the 3 months of rate exposure that you need until your current asset matures and you can roll over your investment into a new 3-month asset.
Whatever you choose to do, you cannot avoid having a few days of rate mismatch. For example, the true value date for an expiring S&P 500 futures contract is 3 business days after the final settlement value of the contract is determined. Thus, if you choose a money maturity equal to the final settlement date for the futures contract, you will have 3 business days of rate mismatch. Also, if you choose to gain flexibility in your roll strategy by using the Eurodollar contract to provide you with the rate coverage you need, you might choose to have the money market asset mature on the value date for the expiring Eurodollar contract. Since this is the third Wednesday of the contract month, it would fall 2 days before the final settlement value of the expiring S&P 500 futures contract. Thus, you might have as much as 6 days of mismatch in your money market rate exposure.