4.4. Reasoning Networks (2)
In the preceding section, we discussed an uncertain reasoning model in OR-graph. An uncertain reasoning model in AND/OR graph is now discussed. Let’s, first, consider the following example.
Example 4.5
In two players, perfect-information games, such as chess, checkers and GO, there are two adversary players who alternate in making moves. At each turn, each player makes one move according to the rules of the game which define both what moves are legal and what effect each possible move will have. Each player has complete information about his opponent’s position and all available choices, viewing the opponent’s failure as his own success. The game begins from a specified initial state and ends in a position that can be defined as a win for one player and a loss for the other, or possibly as a draw based on the same criterion.
An AND/OR tree, or game tree, is a representation of whole possible plays of the game. The root node denotes the initial position of the game, its successors are the positions that the first player can reach in one move, and their successors are the second player’s replies, and so on. Terminal or leaf nodes are labeled as WIN (1), LOSS (–1) or DRAW (0). Each path from the root to a leaf node represents a different complete play of the game, as shown in Fig. 4.2.
The moves available to one player from a given position can be represented by OR links, whereas the moves available to his opponent are AND links, since each of them must be considered in response.
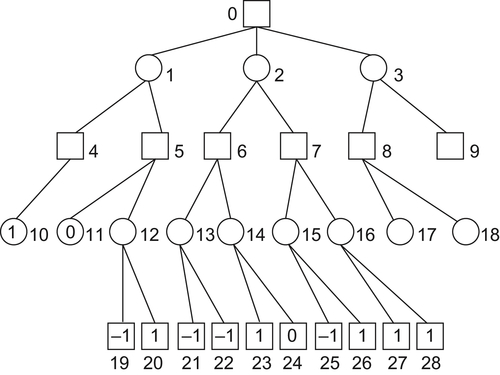
We call the first player MAX and his opponent MIN. Correspondingly, the game positions where it is MAX’s or MIN’s turn to move are named as MAX and MIN positions, respectively. We distinguish between MAX and MIN positions using a different node shape: the former is represented by squares and the latter by circles. The leaf nodes are labeled as WIN, LOSS or DRAW, depending on whether they represent a win, loss or draw position from MAX’s viewpoint.
At the root node, player MAX has three choices. If MAX chooses 0 → 1, MIN 1 → 4, and MAX only 4 → 10, terminal node 10 marked ‘1’, MAX win. If after MAX chooses 0 → 1, MIN chooses 1 → 5 rather than 1 → 4, then MAX has 2 choices: either 5 → 11 or 15 → 12, if the former, MAX reaches terminal node 11 marked ‘0’-draw, otherwise, MAX reaches node 11,…
Once the leaf nodes are assigned their WIN–LOSS–DRAW status, each node in the game tree can be labeled as WIN, LOSS, or DRAW by a bottom-up labeling procedure. The labeling procedure is the following.
As shown in Fig. 4.3, let’s walk through the analysis of the game tree from left to right and from bottom to top. Terminal node 10 is assigned as ‘1’, then node 4 is assigned as ‘1’ as well, since MAX only has one choice at node 4. Terminal nodes 19 and 20 are assigned as ‘–1’ and ‘1’, respectively. At node 12, MIN has two choices, 12 → 19 and 12 → 20, and has assignments ‘–1’ and ‘1’, respectively. MIN chooses the minimal one ‘–1’, i.e., 12 → 19. Then, the assignment of node 12 is ‘–1’. At node 5, MAX has two choices, 5 → 11 and 5 → 12, and has assignment ‘0’ and ‘–1’, respectively. MAX chooses the maximal one ‘0’, i.e., 5 → 11. Then, the assignment of node 5 is ‘0’. Finally, we have the overall assignments as shown in Fig. 4.3. The root node is assigned as ‘0’. This means that MAX has a strategy such that he does not lose the game no matter what strategy MIN used. Similarly, MIN has a strategy such that he does not lose the game no matter what strategy MAX used.

A strategy for MAX is to explore a sub-graph T∗ (or sub-tree) of graph T which is rooted at s and contains one successor of every non-terminal MAX node in T∗ and all successors of every non-terminal MIN node in T∗. The sub-graph T∗ is called a solution graph.
As mentioned in Chapter 1, many reasoning processes can be explicitly represented by AND/OR graphs (or trees). AND/OR graphs and OR graphs differ only in the relations between nodes and their successors. The former has two kinds of nodes. The MAX positions are OR nodes which are identical to the nodes in OR graphs. The MIN’s positions are AND nodes which are unique to AND/OR graph since a response must be contemplated to each of them. If T∗ is a solution sub-graph, all its leaf nodes have been assigned. The assignment of a non-terminal OR node is the minimal one among assignments of all its successors. The assignment of a non-terminal AND node is the maximal one among assignments of all its successors. The assignment process going through from bottom to up, finally, we have the assignment of root node. It is called the assignment of solution graph T∗.
Solution graph T∗ having the maximal assignment at root node is called the optimal solution graph or the optimal strategy for player MAX. Therefore, the optimal strategy of a finite game can be transformed into solving the optimal solution graph of a corresponding AND/OR graph.
In a rule-based first-order logic deductive system, if axioms and reasoning rules are given, the verification of a goal formula can be transformed into whether the formula belongs to a solution graph of an AND/OR graph. Certainly, the backward reasoning can be used as well, i.e., whether there is a solution graph with the given goal formula as its root and given facts as its leaves.
A backward reasoning example is given below.
Example 4.6
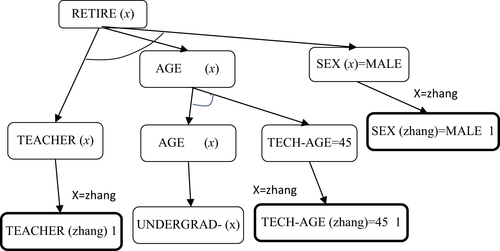
From known facts and reasoning rules, infer whether TEACHER (zhang) has retired or not.
Known Facts:
Reasoning Rules
The known facts are assigned as ‘1’ as shown in Fig. 4.4. If b is an AND node and has successors  , the assignment
  of b is
  , where
  is an assignment of
  . If b is an OR node and has successors
  , the assignment
  of b is
  . Finally, the assignment of root node is ‘1’, i.e., the confirmation of RETIRE (zhang).
The above discussion is confined to deterministic cases, i.e., both facts and reasoning rules are certainty. The problem is that when both known facts and reasoning rules are uncertain, how can a reasoning model be established? As discussed in Section 4.3, uncertain information can be represented at different grain-size worlds. And a reasoning function defined on a set of edges D depicts the uncertainty of causal relations.
In the next section, our discussion will focus on the projection and synthesis problems of AND/OR reasoning model.
4.4.1. Modeling
X is a domain. Given a premise A, A is a subset of X. f is an attribute function defined on A. f depicts the uncertainty of A. Therefore, a premise can be represented by  .
.
Reasoning Rules
If all events  hold, it implies b. We define
  as AND sub-nodes of b. If any of events
  holds, it implies b. We define
  as OR sub-nodes of b.
If b has either OR sub-nodes or AND sub-nodes, these sub-nodes may be represented by a disjunctive normal form. For example,
![]()
Let  . We decompose these sub-nodes into two levels,
  are OR sub-nodes of b, and
  are AND sub-nodes of
  . The causal relations among events of X are represented by an AND/OR graph. The graph’s structure is denoted by T.
Reasoning Function
D is a set of edges in X. Define  , where (a, b) is an edge. Therefore, function g is an uncertainty measurement of causal relation between events a and b, and is called reasoning function.
Reasoning Rule
(1) If b is an AND node and  are its AND sub-nodes, we define
![]() (4.19)
(4.19)
(2) If b is an OR node and  are its OR sub-nodes, we define
![]() (4.20)
(4.20)
Given a goal event  , the process of finding p from a given premise A is represented by a reasoning model
![]()
Similar to Section 4.3, the transformation of the model among different grain-size worlds should be discussed, namely, the projection and synthesis problems.
Assume that reasoning rules are unchanged during the transformation. The projection and synthesis approaches of X, D, A, p, f and g are the same as that presented in Section 4.3. We now focus our attention on the projection and synthesis of AND/OR relations, i.e., structure T.
4.4.2. The Projection of AND/OR Relations
According to the method presented in Section 4.3.1, a model  can be constructed.
Now, we define the projection  of structure T.
Regarding all nodes in T as OR nodes, we have a structure  . Assume that
  is an equivalence relation with respect to X1. Viewing
  as a semi-order,
  is assumed to be compatible with
  . Based on the method shown in Section 4.3.1, a quotient semi-order
  of
of  can be constructed. Namely,
  is a projection of
  on X1.
Assume that  ,
,  are all sub-nodes on X1 of b and is called a set of sub-nodes of b.
Definition 4.1
![]()
Example 4.7
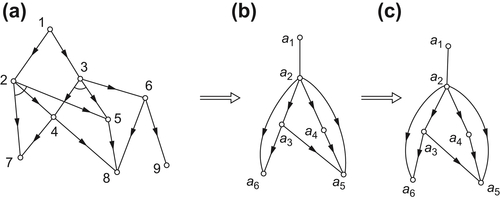
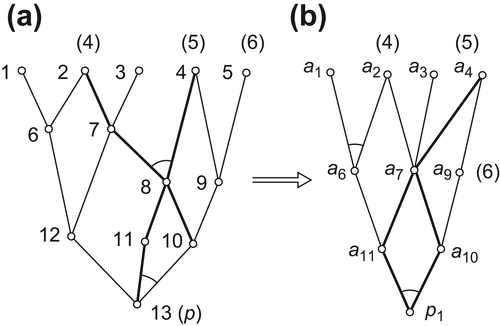
Find a corresponding AND/OR graph  on X1.
Solution
We first transform the AND/OR graph  into a semi-order set. It is known that the semi-order is compatible with the equivalence relation corresponding to X1. Graph
  can be constructed as shown in Fig. 4.5(b).
According to the definition of the projection of AND relations, we have an AND/OR graph as shown in Fig. 4.5(c).
We next show that the projection defined in Definition 4.1 satisfies the homomorphism principle under a certain condition.
Assume that  . We define
  .
.
Let  .
.
where, x is an AND sub-node of y and (x,y) is an edge.
Let  .
.
where, x is an OR sub-node of y.
Let the projection of the given model be
![]()
Theorem 4.1
Under the definition above, if  is the consequence inferred on X, and
  is the consequence inferred on X1, then
  , namely, the homomorphism principle is satisfied.
Lemma 4.1
For  ,
,  is a set of sub-nodes of y. The value of
  is known.
  , where
  is a projection. Assume that
  . If
. If  is inferred from
  and
and  is inferred from
  according to the reasoning rule, then
  .
.
Proof
For simplicity, assume that 
First, assume that y is an AND node, namely,  .
.
If  ,
,  . If
. If  , from the definition of
  ,
,  is a sub-node of b on
  . If b is an OR node, then
![]()
If b is an AND node, then b has no more sub-node except  . Otherwise, assuming that c is an another sub-nodes of b, namely, for
  , from Definition 4.1, there exists a sub-node
  of y. Since
  we have
  . This is a contradiction. Thus,
  are the whole AND sub-nodes of b. Therefore,
![]()
Similarly, when y is an OR node, the same is true.
The Proof of Theorem 4.1
Assume that T is a solution graph in X rooted at p and the value of T is d. The theorem can be proved by induction from leaf nodes to the root node of T and Lemma 4.1.
Example 4.8
Given an AND/OR graph (X,F) shown in Fig. 4.6(a), a set  of premises and a goal
  . Assume that
  and
and  .
.  .
.  are defined as shown in Theorem 4.1. p1 is the corresponding goal in X1 and the projection of p. Find
  and
and  .
.
Solution
From graph  shown in Fig. 4.6(a), we construct a corresponding graph
  (see Fig. 4.6(b)). In Fig. 4.6(a), sub-graph T shown as a bold line is a solution graph with respect to p. From T, we have the result
  . In Fig. 4.6(b), sun-graph
  shown in bold is a solution graph corresponding to
  . From
  , we have the result
  .
.
Note that the reasoning model constructed by using the projection of AND/OR relations T defined in Definition 4.1 does not guarantee the satisfaction of the homomorphism principle. It not only depends on the definition of the projection but also the forms of f, g,  ,
,  and whether R1 is compatible with T or not.
In general, it is unlikely to present a uniform definition of projection of T such that in any reasoning model the homomorphism principle is satisfied. Theorem 4.1 shows that the existence of such a projection only under a certain condition.
4.4.3. The Synthesis of AND/OR Relations
In this section we discuss the synthesis of AND/OR relations of two quotient spaces.
In two quotient spaces with AND/OR structures, we have their reasoning models below and
and  are quotient spaces of X.
![]()
![]()
The synthetic procedure is the following. First, having transformed given AND/OR graphs into their corresponding OR graphs, we then find the synthesis of the transformed OR graphs. The synthetic OR graph is transformed into a corresponding AND/OR graph. The latter is regarded as the synthesis of given AND/OR graphs.
Assume that  is an AND/OR graph. If all its nodes are regarded as OR nodes, we have an OR graph denoted as
  . Given
![]()
![]()
The synthetic rules are shown below.
We have  .
.
Note that taking the image of  on
on  as
as  , it implies that
  and
and  are two solutions of the same goal from different perspectives. If
  , it means that there exists a contradiction between the solutions inferred from different perspectives, or
  and
and  are actually two independent problems being mistaken as two perspectives on the same problem.
While taking the image of  on
on  as
as  , it implies that we solve
  and
and  together in the hope of that premises
  and
and  might be favorable for solving
  and
and  , respectively. Therefore, the definition of
  depends on actual demand.
Now, we transform  into the corresponding AND/OR structure
  .
.
Suppose that  is a set of sub-nodes of y in structure
  . Let
. Let and
and  .
.
![]()
Otherwise,  is called a set
  of OR sub-nodes of y.
Therefore, we have a reasoning model with AND/OR structure.
![]()
It is called the synthesis of the reasoning models in  and
and  .
.
Note that the transformation from  to
to  is not unique. For example, we can define as follows.
Otherwise,  is called a set
  of OR sub-nodes of y.
So far we have provided a theoretical framework for the synthesis of different reasoning models. To illustrate its applications, we give an example below.
Example 4.9
There are 100 pupils in a class. In the first semester they took examinations in Chinese and Mathematics. Fifteen out of 100 pupils did not pass the Chinese test. Twenty pupils did not pass the Mathematics test. After make-up examinations only half of them passed these examinations. According to administration regulations, those who did not pass two course tests will fail to go up to the next grade, while those who did not pass one of them will remain in the class.
In the second semester, the pupils took one examine in Physics. Twenty pupils did not pass the test. After make-up examination only half of them passed the test. Those who have accumulatively two courses below pass level will fail to go up to the next grade based on the regulations. Determine how many pupils fail to go up to the next grade and how many pupils have one course below pass level in two semesters.
Since we don’t know the details of each pupil’s scores, we can only make estimates.
First, by using the synthetic approach, we make the estimation under ‘maximal entropy principle’. Assume that  represents a set of pupils who pass the Chinese test. The others are represented by
  .
.
Similarly,  represents a set of pupils who pass the Mathematics test. The others represented by
  .
.
Therefore,  represents those who do not pass these two examinations. While
  represents those who pass these two examinations.
  and
and  represent those who only pass one of the examinations.
Thus,  .
.
![]()
Using the ‘maximal entropy principle’, namely, no matter whether pupils pass Chinese examination, the probability that they pass the Mathematics examination is assumed to be the same. We have a synthetic function  of
of  and
and  below.
![]()
![]()
The reasoning network is shown in Fig. 4.7. The network has four levels, from top to down, the first level – the first semester examination, the second level – the first semester make-up examination, the third level – the second semester examination, and the fourth level – the second semester make-up examination. Where nodes without marks indicate those who pass these two tests, nodes marked ‘1’ indicate those who only pass one of the tests, nodes marked ‘2’ indicate those who do not pass any test before make-up examination, nodes marked ‘x’ indicate those who fail to go up to the next grade.
We number each node as shown in Fig. 4.7. The numbers close to each edge are the values of  . The numbers within brackets are the values of
  .
.
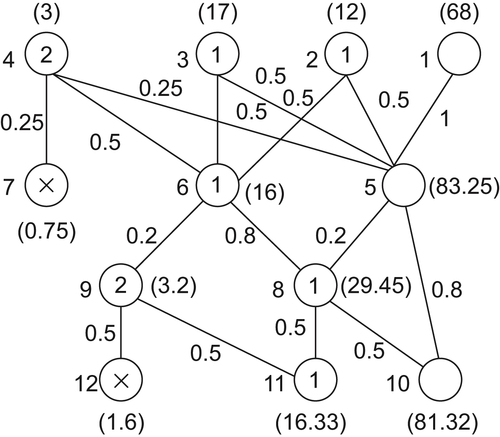
The ‘maximal entropy principle’ is also used for analyzing the physics examination. Therefore,  ,
,  , etc. as shown in Fig. 4.7.
Reasoning rule is  , where the sum
  is over all sub-nodes of y.
The final results are 0.75 + 1.6 = 2.35(%) of pupils who fail to go up to the next grade after two semesters, and 16.33(%) of pupils who still do not pass one course’s test after make-up examinations.
"Maximal entropy principle’ means that no additional information is added in the synthetic process. If an additional knowledge is added, the conclusion will be different. For example, assume that ‘if a pupil does badly in his studies, generally, the score of each course is low’. This means that the probability that a pupil passes the Mathematics test will depend on whether he passes the Chinese test or not. In one extreme, those pupils who do not pass the Chinese test must not pass the Mathematics test, then we have  .
.
To estimate the result of the Physics test we, however, still use the ‘maximal entropy principle’. From Fig. 4.7, we have 4.75% pupils who fail to go up to the next grade after two semesters, and 13.63% pupils who still have one course below pass level after the make-up examination.
If another extreme is adopted, namely, the pupils who do not pass the Chinese test must pass the Mathematics test, then we have
![]()
The ‘maximal entropy principle’ is still used for analyzing the Physics examination. We have 1.75% pupils who fail to go up to the next grade and 17% pupils who do not pass one of the examinations.
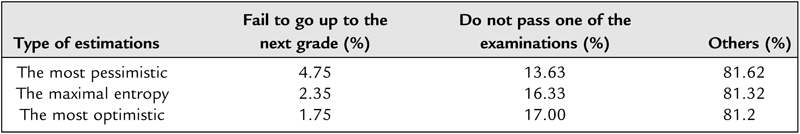
Three estimation results are listed in Table 4.5.
It is noted that the maximal entropy estimation is somewhere between the two extreme cases, the most pessimistic and the most optimistic estimations.
Table 4.5
The Comparison of Three Different Estimations
| Type of estimations | Fail to go up to the next grade (%) | Do not pass one of the examinations (%) | Others (%) |
| The most pessimistic | 4.75 | 13.63 | 81.62 |
| The maximal entropy | 2.35 | 16.33 | 81.32 |
| The most optimistic | 1.75 | 17.00 | 81.2 |
4.4.4. Conclusion
In this section, the uncertain reasoning model on an AND/OR graph (OR graph) is defined. The projection structure from space X to its quotient space is discussed and how to synthesize a spatial structure from structures of two different quotient sets is also involved. We prove that only under a specific definition of projection and a certain reasoning rule, the homomorphism of quotient structures holds. As mentioned in the section, the homomorphism principle is very important in quotient structure analysis. The efficiency of multi-granular computing depends on the satisfaction degree of the homomorphism principle to a great extent. The aim of analyzing coarse grained spaces strives for denying the existence of ‘the solution’ in some regions of the spaces. The larger the region the more efficient the multi-granular computing is.
..................Content has been hidden....................
You can't read the all page of ebook, please click here login for view all page.