
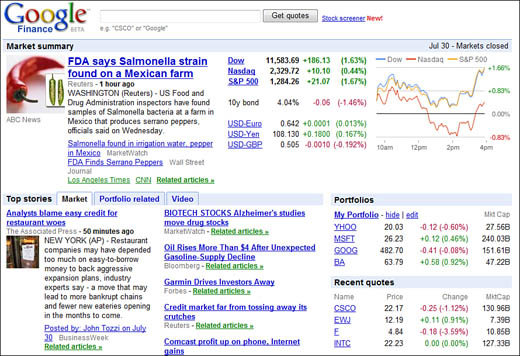
The main Google Finance page (finance.google.com), shown in Figure 31.1, offers a variety of general financial news and information. Here’s what you’ll find:
-
Market summary. This section displays the latest Dow, Nasdaq, and S&P 500, as well as an intra-day graph of all three indexes. Click any exchange link to view detailed trading data and news.
-
Top stories. The top financial headlines, as reported from a variety of news sites; click any headline to read the entire story. Stories are organized by tab in three categories: Market, Portfolio Related, and Video. To view additional headlines, scroll down to the bottom of the section and click the View All of Today’s News link.
-
Sector summary. A table of price movement by sector.
-
Portfolios. Stock prices for those securities in your personal portfolios.
-
Recent quotes. This is a list of stocks/companies you’ve recently searched for, accompanied by the current stock price.
-
Trends. A list of today’s trend-setting stocks—in terms of popularity, price, market cap, and volume.
Then, of course, there’s the ubiquitous Google search box at the top of the page. This isn’t a standard Google search box, however; you use this search box to search Google Finance for specific company and stock information. Just enter a stock symbol or company name, and the matching company page will be displayed.
Tip
You can also display basic stock information from the main Google search page. The easiest way is to simply enter the stock or fund symbol into Google’s search box, without any additional keywords, although you can preface the symbol with the stocks: operator. Using the operator is recommended if you’re looking up multiple stocks at one time. This displays a OneBox section on the search results page, which includes a graph of the current day’s stock performance; the current stock price; opening, high, and low prices; volume and average volume; and market capitalization (market cap).
General financial information is good; more detailed information on specific companies, stocks, or mutual funds is even better. To that end, Google Finance offers dedicated pages for companies and securities, complete with all sorts of useful news and data.
To view a company/security-specific page, you can click the security’s name anywhere it’s displayed on the Google Finance site or in general Google search results. Alternatively, you can search for that company or security using the search box at the top of the Google Finance main page; instead of a list of search results, Google will display the dedicated company/security page.
Tip
Stock quotes from Google Finance can also be delivered to your cell phone or PDA via SMS text messaging. Learn more in Chapter 35, “Using Google on Any Mobile Phone.”
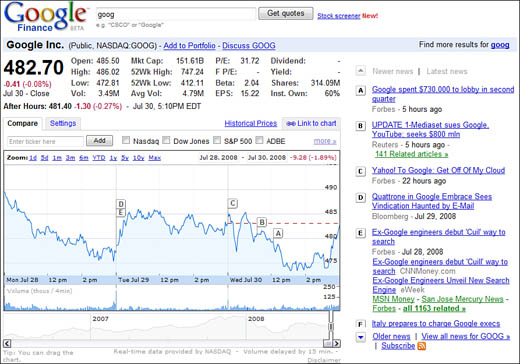
As you can see in Figure 31.2, a dedicated company/security page includes a plethora of financial information. Here are the major sections you’ll find:
-
Key metrics. Located in the top-left corner of the page, these include the company/fund name, ticker symbol, current price, dollar/percentage change, open/high/low prices, trading volume and average volume, market cap, 52-week high and low prices, price/earnings (P/E) ratio, forward price/earnings (F P/E) ratio), beta, and earnings per share (EPS). In addition, you can view and download (in spreadsheet format) historical end-of-day prices by clicking the Historical Prices link in this section.
-
Stock chart. This chart tracks the price of the stock over any period from 1 day to 10 years (or more). Key events are noted on the chart by letters; each letter corresponds to one of the news stories displayed to the right of the chart. (Read more about how to use these interactive charts later in this chapter.)
-
Recent stories. These numbered headlines correspond to the numbered events on the 1-week stock chart. Click any headline to read the complete story.
-
Related companies. A list of market sectors and companies that are similar to the company in question. Click any company link to view that company’s dedicated Google Finance page.
-
Discussions. A list of posts discussing the company in the Google Finance Groups. (Learn more about Google Finance Groups later in this chapter.)
-
Blog posts. From Google Blog Search, blog postings from around the blogosphere that discuss the company and its stock. Click a posting title to read more, or click the More Blogs link to view more related posts.
-
Financials. Key financial data from the company’s most recent annual report, including income statement, balance sheet, and cash flow numbers.
Tip
To add any upcoming company event to your Google Calendar, click the Add to Calendar link. Learn more about Google Calendar in Chapter 22, “Using Google Calendar.”
-
Events. Recent and upcoming financial events for the company.
-
Summary. A brief description of what the company is and what it does.
-
Key Stats & Ratios. More data about the company, including net profit margin, operating margin, return on average assets, return on average equity, number of employees, and such.
-
Officers and directors. The names and titles of the company’s key officers and senior management.
-
More Resources. Links to additional information about the company, in the form of SEC filings, analyst estimates, research reports, and the like. Click any link to learn more.
Commentary
The stock chart displayed on the company/stock Google Finance page is more informative than it might first appear. That’s because this is an interactive chart that you can manipulate to display a variety of different information. You can click the chart to display more or different information.
First of all, you can change the date range displayed on the chart—in several different ways. Quick view zooming is accomplished by clicking the 1d (1-day), 5d (5-day), 1m (1-month), 6m (6-month), 1y (1-year), or Max (life-to-date) links. You can also click and drag the chart to the left or right to display a different range of dates; just hover your cursor anywhere on the chart, hold down the left mouse button, and drag.
In addition, the overview graph just above the main graph displays the stock’s price over the life of the stock, with the currently selected range for the main chart displayed as a small slice of the life-to-date chart. To enlarge or shrink the time span displayed in the main chart, click and drag the left positioning handle in this “window” on the subsidiary chart. Alternatively, you can drag the positioning button below this “window” to display a different date range.
Note
To fully display Google Finance charts, your computer needs to be running Microsoft Windows 2000, Windows XP, Windows Vista, Mac OS, or Linux. You also need to be using a current version of the Internet Explorer, Firefox, Opera, or Safari web browsers, and have Macromedia Flash Player 7.0 or higher installed. (The charts themselves are displayed using Flash technology.)
Another fun thing about these interactive charts is the ability to display price information at a specific time. All you have to do is hover your cursor over a specific spot on the trend line, which highlights a specific date and time of day. The price and volume information for that point in time is displayed at the top of the chart.
And, as discussed previously, key news stories about the company are pinpointed on the chart by a series of letter buttons (A, B, C, and so on). Click a letter and the corresponding news story is highlighted in the section to the right of the graph. Click the headline to read the full story.
There’s one other section on the Google Finance site that you might find useful: the Portfolios page, shown in Figure 31.3. You access your portfolio by clicking the Portfolios link at the top of the main Google Finance page. (This feature is visible only if you have a Google account and if you’re signed in at the time.)
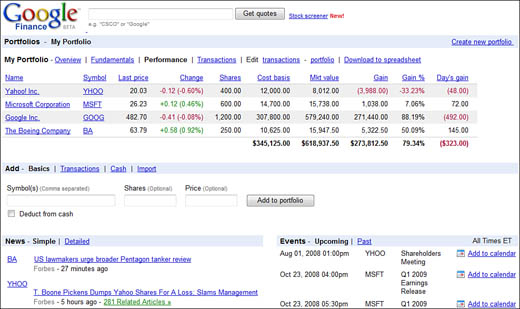
Your Google Finance portfolio is how you track the performance of a selected group of stocks and mutual funds, right from the main Google Finance page. This list can be those stocks in your actual portfolio, or simply a group of stocks in which you have interest. In any case, it’s a good way to put the financial information you’re most interested in front and center on the Google Finance page.
What information is included on the Google Finance Portfolio page? For each stock, you’ll see the following:
-
Company or fund name (click either the symbol or name link to view the detailed Google Finance page for that security)
-
Symbol
-
Last price (current trading price)
-
Change (dollar and percentage change from previous day price)
-
Shares (the number of shares you own, if entered)
-
Cost basis (your total investment in this security, if you entered price and share information)
-
Mkt value (the current value of your investment in this security, based on the current share price, if you entered price and share information)
-
Gain/loss (your current gain or loss on this security, if you entered price and share information)
-
Gain/loss % (your current gain or loss, as a percent of your purchase price)
-
Day’s gain/loss (the amount of money you’ve gained or lost on that stock today)
To create your portfolio, make sure you have a Google account and that you’re signed in before you access the Google Finance page. (Alternatively, you can click the Sign In link at the top of the Google Finance page.) Once you’re signed in, you can then create your Google Finance Portfolio. Just follow these steps:
-
Click the Portfolio link at the top of the Google Finance page.
-
When the Portfolios page appears, enter the stock symbol you want to track into the Add section.
-
If you want to track performance versus cost, you should also enter the price you paid and how many shares you own (both optional).
-
Click the Add to Portfolio button.
-
Repeat steps 2–4 to add additional stocks to your portfolio.
-
When you’re done adding stocks, click the Google Finance logo to return to the main Google Finance page.
You can add new stocks to your portfolio at any time by entering the Symbol, Price, and Shares information and clicking the Add to Portfolio button. You can also change your portfolio information by clicking the Edit Portfolio button, and then changing the Buy Price and Shares information for any listed security. To delete any security from your portfolio, click the Delete link next to the security.
Tip
To track a security with multiple shares purchased at different prices, you’ll need to enter each purchase of the security separately.
When you’re looking for good stocks to invest in, use Google’s Stock Screener feature. The Stock Screener lets you specify various performance parameters, and then generates a list of stocks that match those parameters.
To access the Stock Screener, click the Stock Screener link next to the Google Finance search box. This displays the screener page shown in Figure 31.4. You now enter the desired minimum and maximum values for the following parameters:
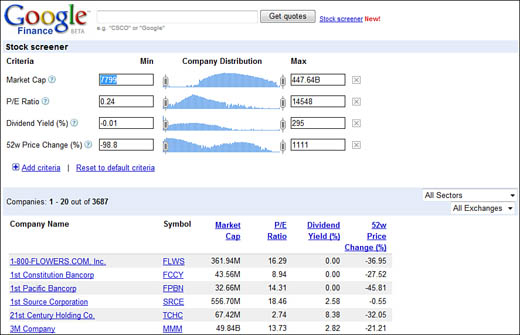
You can add more parameters by clicking the Add Criteria link. The stocks that meet these parameters are listed below the screener section.
Savvy investors know that dry financial data can only tell you so much. Often, it helps to get opinions and tips from other investors—to test the waters, so to speak, by talking to people who might have a little more information (or a few more opinions) about the company in question.
One of the best places to find like-minded investors is on the Google Finance Discussion Groups. This is a subset of the overall Google Groups discussion forums, tailor-made for financial discussions.
The Google Finance Discussion Groups differ from standard Google Groups in that the Google Finance discussions are moderated by Google staffers. The intent is to keep the junk off the boards; postings are monitored to find and delete spam, pornography, hateful or harassing content, and offers to buy or sell any security. It’s kind of a sanitized version of the discussions you find at other financial information sites—sanitized for your protection, or so Google says.
Google Finance discussions are organized by company. You access the discussions for a given company by going to the company’s dedicated Google Finance page, scrolling down to the Discussions section, and clicking the More Discussions link. This displays a Discussions page, like the one shown in Figure 31.5.
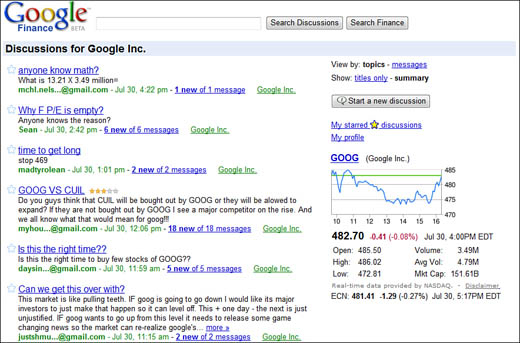
Messages are listed in reverse chronological order, with the newest messages at the top of the left column. To view older messages, scroll to the bottom of the page and click the Older link.
To read a complete message, all you have to do is click the message header. This displays a page like the one shown in Figure 31.6, where the message you clicked and all other messages in the same thread are displayed, in chronological order. For each message, you see the poster’s Google account ID, a link to the poster’s profile, the date posted, a rating for this message, and then the message text.
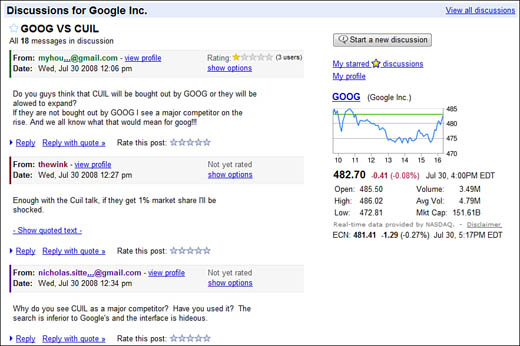
The message rating is an interesting feature. Readers are encouraged to vote on the messages they read, assigning each message a rating on a scale of 0 to 5 stars. It’s an attempt to highlight those messages that other users find the most useful.
To reply to a message, click the Reply link below the message text. This opens a Reply text box; enter your reply into this box, and then click the Post button. Your reply will now be added to the thread in progress.
You’re not limited to replying to existing messages, of course. You should feel free to start your own discussions, about topics that interest you.
Tip
Before you can rate a message or start a new discussion, you have to create a Google Finance profile aside from your normal Google account. To create a profile, go to any company’s Discussions page and click the My Profile link in the right column. When the My Profile page appears, click the Edit link; when the Edit My Profile page appears, enter the required information; then click the Save button.
To start a new discussion about a particular company, follow these steps:
-
Go to the company’s main Discussions page.
-
Click the Start a New Discussion button.
-
The first time you post, you’ll see the Finance Posting Application page. Assuming you agree with the terms, check the I’ve Read and Accepted... option, and then click the Next Step button. You’ll now see your Google Finance profile; if you’ve not yet filled in the blanks, do so now, and then click the Next Step button.
-
When the Start a New Discussion page appears, enter a subject for the message, and then enter your message text. (You can preview your in-progress message by clicking the Preview button.)
-
If you want a copy of the message emailed to you, check the Send Me a Copy of This Message option.
-
When you’re done composing your message, click the Post Message button.
Your message will now be reviewed by Google staff. If you pass muster, the message will be posted to the discussion group.