
Google’s Webmaster Tools is a free service that analyzes the traffic coming into any registered website. Unlike some analytic tools (such as Google’s own Google Analytics, which we’ll discuss later in this chapter), you don’t have to insert any code into your web pages to generate Webmaster Tools data. (It does help, however, if you’ve submitted a sitemap of your website to Google beforehand.)
To access Webmaster Tools, start at Google Webmaster Central (www.google.com/webmasters/) and click the Sign In to Google Webmaster Tools link. This displays the Dashboard shown in Figure 42.1.
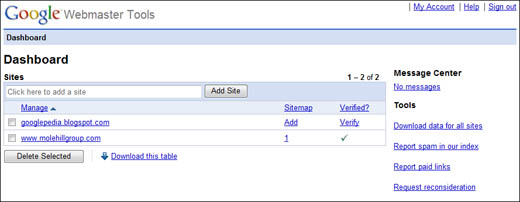
The Webmaster Tools Dashboard lists all the websites you’ve registered with Google to date. You can add websites to the Dashboard via the Add Site box at the top of the page.
Once added, Google performs all available analysis.
Tip
You can access the Google Webmaster Tools Dashboard directly at www.google.com/webmasters/tools/.
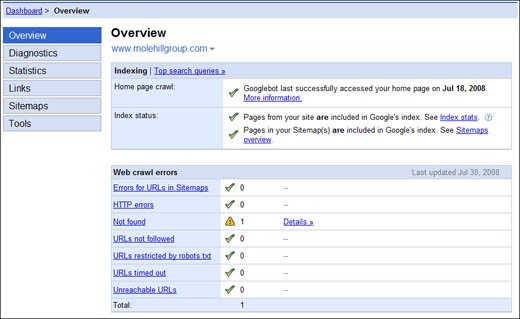
To view details about a website, click the site’s name in the Dashboard. This displays the Webmaster Tools Overview page, shown in Figure 42.2. This page conveys the following information about your site:
-
When Google last crawled your site.
-
Whether or not pages from your site are included in the Google index.
-
What type of errors, if any, Google found when crawling your site.
Additional information is available by clicking the links along the left side of this page, which we’ll discuss next.
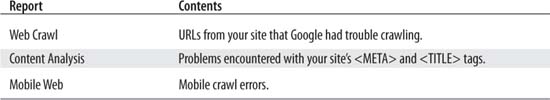
When you click the Diagnostics link, you have access to various types of diagnostic information. Table 42.1 details the available reports.
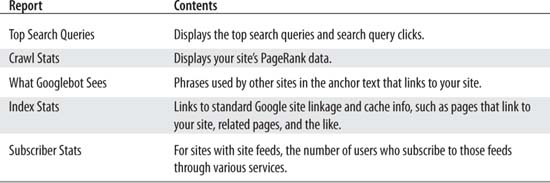
Although Google’s diagnostic information is useful, I find its statistical information much more interesting. Here is where you’ll get the most information about your site traffic, as detailed in Table 42.2.
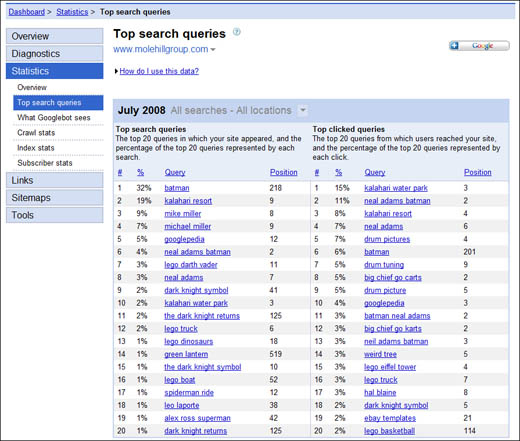
For example, the Top Search Queries page, shown in Figure 42.3, lists the top search queries that visitors used to find your site, as well as which of those search queries generated the most clicks. (Click any link to view the Google search for that phrase.)
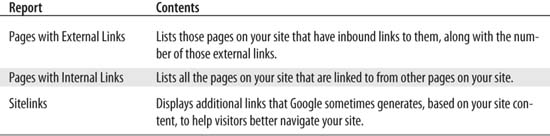
Google offers three reports that help you analyze your site’s internal and external (inbound) links. These reports are detailed in Table 42.3.
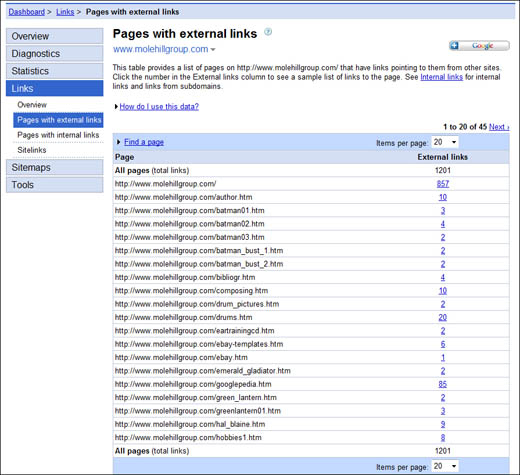
For example, Figure 42.4 shows the Pages with External Links report. Click the link number to view all the sites that link to that page.
When you click the Sitemaps link, Google displays a page that lists some brief statistics about the sitemaps you’ve submitted. This information includes the sitemap status and how many pages were included in the sitemap.
Google offers additional tools for webmasters, found by clicking the Tools link in the Webmaster Tools Dashboard. Table 42.4 details the available tools.
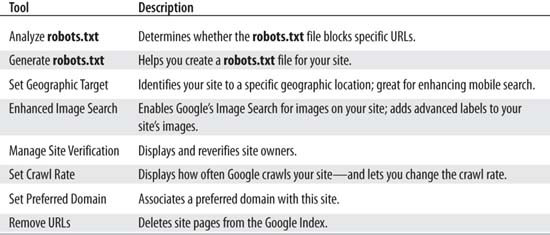
You shouldn’t gloss over these tools; a few are extremely useful for optimizing your site’s performance.
In particular, the Generate robots.txt tool is a great way to create a robots.txt file for your site. As you learned in Chapter 38, you use the robots.txt file to tell the GoogleBot spider software where your sitemap file is, which pages you don’t want crawled, and the like. Google’s tool lets you create a robots.txt file just by selecting options from a series of pull-down lists. It’s much easier than trying to create such a file by hand.
Although Google’s Webmaster Tools are useful, they’re a little Spartan in their approach. If you want more in-depth and more colorful analysis, turn to Google’s other set of tools for webmasters—Google Analytics.
Google Analytics (www.google.com/analytics/) generates a variety of detailed statistics about your website’s visitors. You can use Google Analytics to determine the following:
-
The number of visitors to your site and how much time they spend there
-
How fast an Internet connection is used by your visitors
-
The types of web browsers and screen resolution used by your site’s visitors
-
Which sites are sending you the most traffic
-
Where, geographically, visitors are coming from (on a city level)
-
What keywords your visitors searched for to find your site
-
Which pages on your site were most popular
-
The most popular entrance (landing) and exit pages on your site
-
Visitor trending over time
To use Google Analytics, you have to first sign in with your Google account, and then sign up for the GA program. Participation is free.
The first time you log onto Google Analytics, you’re prompted to provide some key information about your website—the site’s URL, your name and contact info, and so forth. When you’re done with this, Google creates your GA account and displays a block of HTML code. This code block must be inserted into the underlying HTML of each page you want to track; the code goes in the body text section of your page, immediately before the final </body> tag. The code looks something like this:
<script type="text/javascript">
var gaJsHost = (("https:" == document.location.protocol) ? "https://ssl."
: "http://www.");
document.write(unescape("%3Cscript src='" + gaJsHost +
"google-analytics.com/ga.js' type='text/javascript'%3E%3C/script%3E"));
</script>
<script type="text/javascript">
var pageTracker = _gat._getTracker("trackingID");
pageTracker._initData();
pageTracker._trackPageview();
</script>
After the code has been inserted, Google Analytics can start tracking the pages on your site.
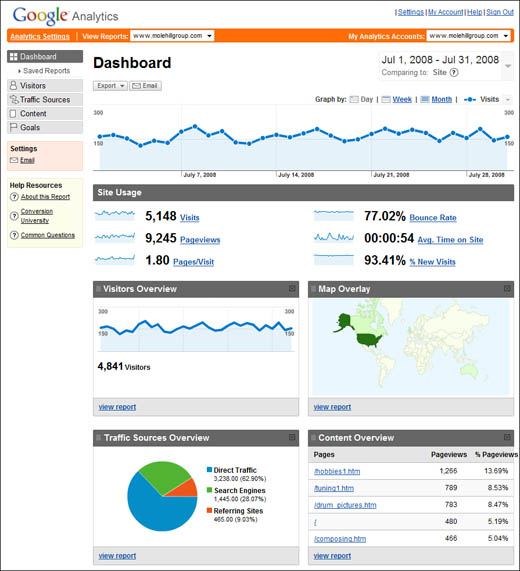
Once you’ve set up your site with the Google Analytics code, and given Analytics time to crawl your site and assembled the requested data, you can then view the reports that Analytics generates about your site. Just go to the main Google Analytics page and click the View Reports link next to your site. This displays the Dashboard page, shown in Figure 42.5. Think of the Dashboard as a summary of the data gathered, as well as a gateway to more detailed reports.
Note
You can configure Google Analytics to track the performance of multiple websites under a single Google account.
The Dashboard displays the following information:
-
Daily site traffic over the past 30 days
-
Site usage statistics: number of visits, pageviews, pages viewed per visit, bounce rate, average time on site, and percentage of new visitors
-
A Traffic Sources Overview pie chart that shows what types of sites (referring or linking sites, search engines, direct URL entry, and other) generated traffic to your site
-
The most popular pages on your site, ranked by number of pageviews
-
A world map that displays where your site visitors are located
Note
The bounce rate is the percentage of users who arrive at your site but then leave without going deeper than the landing page. Obviously, a smaller number is better.
At the top of the dashboard is an interactive graph that can display a variety of different data—visits, pageviews, pages per visit, average time on site, bounce rate, and percent new visitors. Select the data to display from the pull-down list; then click anywhere on the resulting chart to display more information in a pop-up window.
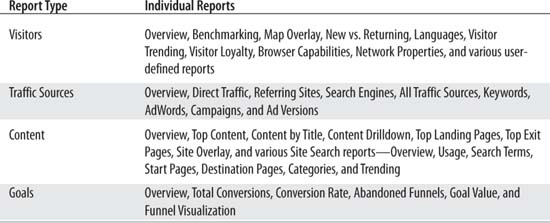
Google Analytics includes 80 different reports and variations that analyze various aspects of your site traffic. These reports are available by selecting the appropriate links on the left side of the Dashboard.
What kinds of reports can you generate? Table 42.5 provides an overview of what’s available.
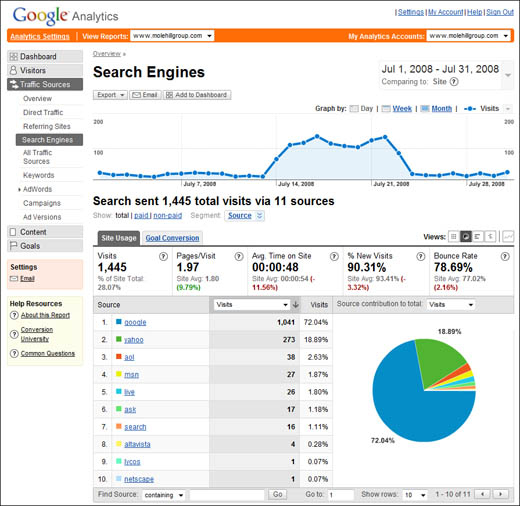
The reports generated by Google Analytics are quite useful and often visual, which makes the data easier to grasp. For example, the Search Engines report, shown in Figure 42.6, shows you which search engines are driving the most traffic to your site. (Not surprisingly, it’s Google that drives the majority of traffic to my own site!)
There’s a lot beneath the surface of Google Analytics—more than can be discussed in this chapter—including the ability to create custom dashboards and reports. I recommend you visit the site, click around the various reports, and check out the help files. I know you’ll find information about your site that will surprise you—and help you increase your site traffic.