
Now that we've finally made it into the software, let's take a look around. You'll notice that there are a lot of subsections in the application window, along with a handful of toolbars and buttons. To make sense of everything that's going on, we're going to break things down into different areas. Before we begin, in the top-right corner of the application window should be three grouped buttons. Make sure they are all blue and active by clicking on them. This will make all of Xcode's shelf areas visible:
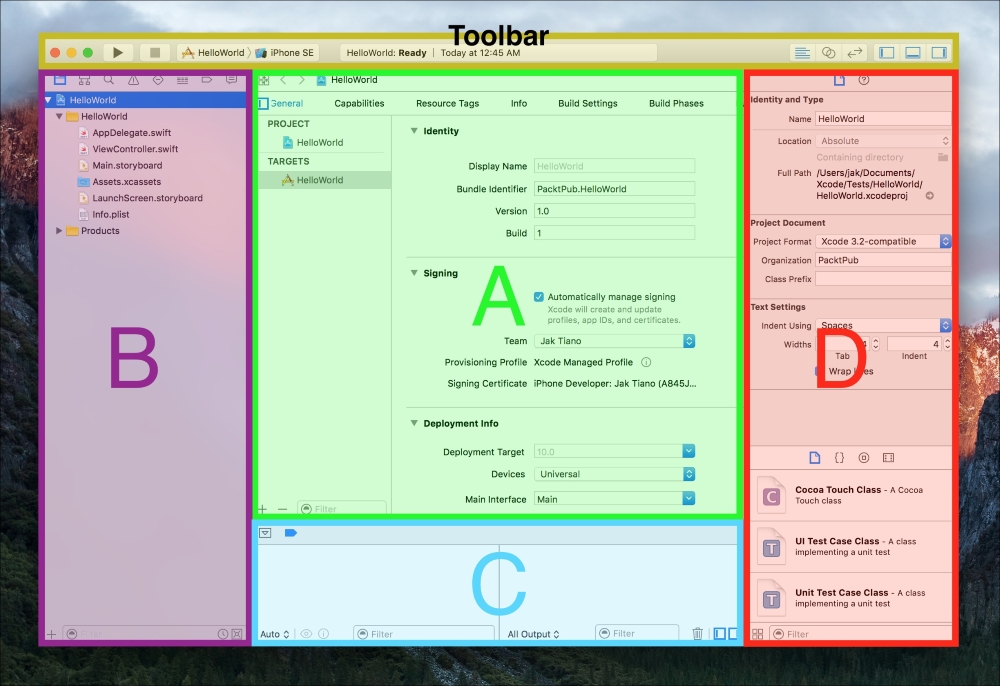
Figure 2.7: A breakdown of the main components of the Xcode application window
At this point, your window should look similar to the preceding screenshot. I've broken down the full window into four separate sections: section A is the editor view, section B is the navigator sidebar, section C is the debug area, and section D is the utilities sidebar. At the very top is the Toolbar; we'll be using the buttons on the far right of the toolbar very frequently throughout the next few sections. Each of these separate sections has its own characteristics and functionalities, so let's dive into each one individually.
The editor is the main part of the application window, and is the only area you cannot hide. Xcode's editor window is equipped to handle many different file types. A little later on in the chapter we'll discuss the most common and important file formats that Xcode can use, but the one thing they all share is that you can modify them in the editor window. The most common uses of the editor are to write source code and build out application views. Since the editor is the main stage, we'll cover it in much more detail in the next section.
The navigator sidebar (labeled as area B in Figure 2.7) is used for a large amount of tasks. You'll find that it is indispensable during development, and that it will be the second most used part of Xcode after the editor.
The initial mode of the navigation sidebar is just that: a project navigator view that lets you navigate and select any of the files in your project. However, if you look along the top of the sidebar, you'll see eight small icons. Clicking each icon changes the functionality of the navigator sidebar. Let's take a look at the most common modes.
The first icon, as already mentioned, is the project navigator. It lets you go through the folders and files that make up your project, and clicking on a file will open it in the editor view. You can also right-click on files or folders in the project navigator to add, modify, or delete them.
The third icon (the magnifying glass) is the find navigator. Simple and straightforward, it's used to find anything you might be looking for in your project. It also has find and replace functionality built in, in addition to being able to change the scope of a search.
The fourth icon (the warning sign) is the issue navigator. When your code has warnings or errors, they will show up here. A yellow warning icon will let you know something is wrong, but your code will still compile and run. A red error icon means something is broken, and must be fixed for the app to be compiled. Clicking on an error or warning in the issue navigator will bring you to the source of the issue in the editor, making it easy to find the issues.
The sixth icon (it almost looks like a sandwich) is the debug navigator. When you are testing your app on a device or a simulator, the debug navigator will show you important metrics, such as CPU and memory usage. We'll cover a lot more of the debugging features in Chapter 14, Debugging an iOS Application.
You can click through the other icons and explore what they do, but for the most part they are used less frequently than the rest.
All the way at the bottom of the navigator sidebar is a filter. Different from the find navigator, this is used to filter the contents of the navigator itself. For example, head back to the project navigator and type in view. You should see the project hierarchy filtered to only show ViewController.swift. You can see how this will be useful when projects get larger.
The debug area (labeled as area C in Figure 2.7) is located along the bottom of the window when active. To show the debug area, you can click the middle button on the right-most grouping of buttons on the toolbar, or use the keyboard shortcut command + shift + Y.
The debug area is split into two sections: the variables view on the left and the console on the right. The variable view is useful when stepping through breakpoints and inspecting the values of variables. The console is where all of your print statements will display, along with any other errors that output to the console.
If you don't understand these terms, that's okay. Like the debug navigator, we'll take a much deeper dive into the debug area and its many functionalities in Chapter 14, Debugging an iOS Application.
The utilities sidebar (labeled area D in Figure 2.7) is located on the right side of the screen when active. Again, you can use the buttons on the very right of the toolbar to show this sidebar, this time with the third button all the way on the right.
The utilities sidebar is split into two sections, top and bottom. The top is a context-sensitive utilities drawer. Like the navigator sidebar, there are icons along the top that change to different functionality tabs. Since it is context-sensitive, the available tabs will change depending on the type of file that is currently active in the editor. The most use that the top section will get is when editing storyboard files. We'll cover these in more detail when relevant throughout the book.
The bottom half of the utilities sidebar is a drag-and-drop object library. The first tab lets you create new files by dragging them into the project navigator. The second tab lets you drag predefined code snippets to your source code. The third tab is the object library for Interface Builder, where you can drag items such as buttons, sliders, and text fields into your view. On the bottom of the utilities sidebar is a filter for the object library, just like in the navigator sidebar.