
All techniques for automatic memory management boil down to keeping track of which objects are being used by the running program, in other words, which objects are referenced by other objects that are also in use. Objects that are no longer in use may be garbage collected. We will use the terms live and in use interchangeably.
It is hard to exactly place garbage collection techniques in different categories. With the risk of drawing fire from the academic community, we will use the term "tracing garbage collection" for everything except reference counting. Tracing garbage collection means building a graph of live objects at a collection event and discarding unreachable ones. The only other kind of technique that we will cover is reference counting.
Reference counting is a memory management technique where the runtime keeps track of how many live objects point to a particular object at a given time.
When the reference count for an object decreases to zero, the object has no referrers left, and trivially, the object is available for garbage collection. This approach was first used in Lisp implementations and is fairly efficient, except for the obvious flaw that cyclic constructs can never be garbage collected. If two objects refer to each other but have no outside referrers, their reference counts are obviously non-zero but they are still unreachable by the GC, consequently turning into a memory leak.
The main advantage of reference counting, aside from its obvious simplicity, is that any unreferenced object may be reclaimed immediately when its reference count drops to zero.
However, keeping the reference counts up to date can be expensive, especially in a parallel environment where synchronization is required. There are no commercial Java implementations today where reference counting is a main garbage collection technique in the JVM, but it might well be used by subsystems and for simple protocols in the application layer.
The concept of a tracing garbage collector is very simple. Start by marking all objects currently seen by the running program as live. Then recursively mark all objects reachable from those objects live as well.
Naturally, the variations to this theme are endless.
From now on, we will use the term root set to mean the initial input set for this kind of search algorithm, that is the set of live objects from which the trace will start. Typically, the root set includes all Java objects on local frames in whatever methods the program is executing when it is halted for GC. This includes everything we can obtain from the user stack and registers in the thread contexts of the halted program. The root set also contains global data, such as static fields. Or even simpler—the root set contains all objects that are available without having to trace any references.
We will discuss how to identify the root sets in more detail later in this chapter.
The mark and sweep algorithm is the basis of all the garbage collectors in all commercial JVMs today. Mark and sweep can be done with or without copying or moving objects (see the section on Generational garbage collection and the section on Compaction for details). However, the real challenge is turning it into an efficient and highly scalable algorithm for memory management. The following pseudocode describes a naive mark and sweep algorithm:
Mark:
Add each object in the root set to a queue
For each object X in the queue
Mark X reachable
Add all objects referenced from X to the queue
Sweep:
For each object X on the heap
If the X not marked, garbage collect it
As can be inferred from the previous algorithm and the explanation of tracing techniques, the computational complexity of mark and sweep is both a function of the amount of live data on the heap (for mark) and the actual heap size (for sweep).
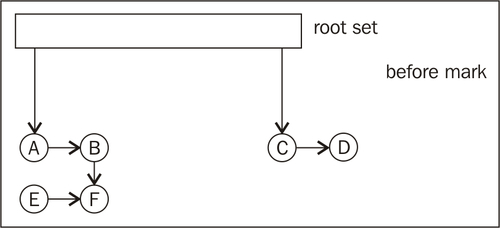
The following figure shows a heap before the mark phase:
First, the live object graph needs to be traversed for marking. Then the entire heap needs to be traversed to identify unmarked objects. This is not necessarily optimal and there are several ways that have been addressed in research over the years to make faster and more parallelizable variants.
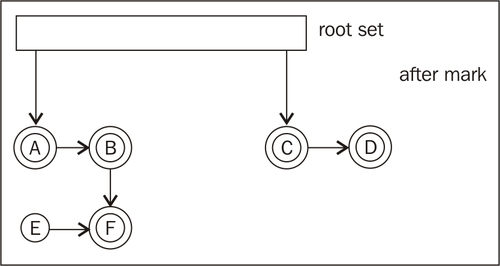
In the following figure, the mark phase is done. All objects that are reachable from the root set have been marked. Only E is not reachable from the root set.
The simplest version of mark and sweep assumes that the object graph doesn't change during the mark phase. This means that all code execution that may modify the object graph through, for example, field reassignments, must be halted when the mark takes place. This is never good enough for modern applications with large data sets.
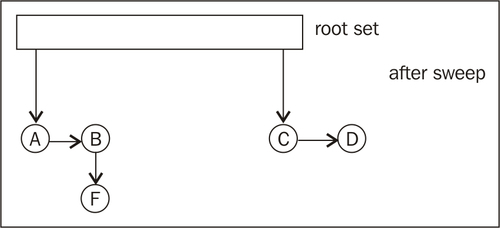
The following figure shows the heap after the sweep phase has taken place and E has been garbage collected:
In naive mark and sweep implementations, a mark bit is typically associated with each reachable object. The mark bit keeps track of if the object has been marked or not. Objects are typically allocated so that they are aligned on even addresses in memory. Thus, the lowest bit in an object pointer is always zero. This is one example of a good place to keep the mark bit.
A variant of mark and sweep that parallelizes better is tri-coloring mark and sweep. Basically, instead of using just one binary mark bit per object, a color, or ternary value is used. The color associated with each object in the object graph is conventionally referred to as white, grey, or black. White objects are considered dead and should be garbage collected. Black objects are guaranteed to have no references to white objects. Initially, there are no black objects—the marking algorithm needs to find them. No black object is ever allowed to reference a white object. Grey objects are live, but with the status of their children unknown. Initially, the root set is colored grey to make the algorithm explore the entire reachable object graph. All other objects start out as white.
The tri-color algorithm is fairly simple:
Mark:
All objects are White by default.
Color all objects in the root set Grey.
While there exist Grey objects
For all Grey Objects, X
For all White objects (sucessors) Y, that X references
Color Y Grey.
If all edges from X lead to another Grey object,
Color X black.
Sweep:
Garbage collect all White objects
The main idea here is that as long as the invariant that no black nodes ever point to white nodes is maintained, the garbage collector can continue marking even while changes to the object graph take place. These changes may be caused by, for example, allocations and field assignments in the executing program. Typically, the marking is "outsourced" so that many parts of the memory manager help maintain the coloring while the program is running. For example, objects may be marked immediately upon allocation.
There are several variants to parallelizing mark and sweep beyond the scope of this chapter. This section merely serves as an example of how mark and sweep can be improved for incremental and parallel garbage collection.
Stop and copy can be seen as a special case of tracing GC, and is intelligent in its way, but is impractical for large heap sizes in real applications.
Stop and copy garbage collection requires partitioning the heap into two regions of equal size. Only one region is in use at a time, which is quite wasteful and ensures that only a maximum of half the available heap memory can be utilized for live data. In its simplest form, stop and copy garbage collection goes through all live objects in one of the heap regions, starting at the root set, following the root set pointers to other objects and so on. The marked live objects are moved to the other heap region. After garbage collection, the heap regions are switched so that the other half of the heap becomes the active region before the next collection cycle.
This approach is advantageous as fragmentation can't become an issue. Surviving objects are laid out first-fit in the new heap section on each garbage collection. As objects are laid out in their referencing order as the object graph is explored, stop and copy can significantly decrease cache overhead for the running program by keeping objects and the objects they reference close on the heap.
The obvious disadvantage of this approach is of course that all live data must be copied each time a garbage collection is performed, introducing a serious overhead in GC time as a function of the amount of live data, not to mention the very serious cache performance issues for the GC itself. More importantly, only using half of the heap at a time is an unforgivable waste of memory.
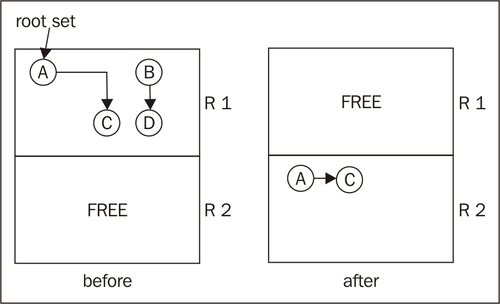
This figure illustrates a stop and copy cycle. The heap is divided into two regions. The root set contains only the object A at the start of garbage collection. A references C and no other objects. The mark phase of the GC cycle determines that A and C are the only live objects, and they are moved to the new region, R2. B and D are garbage collected. A and C were not adjacent in memory in R1, but will be automatically adjacent in R2 as objects are laid out first-come-first-serve from tracing the object graph.
Stopping the world, that is halting all executing Java threads for garbage collection, is the main Achilles' heel of automatic memory management. Even though an algorithm such as mark and sweep may run mostly in parallel, it is still a complicated problem that references may change during actual garbage collections. If the Java program is allowed to run, executing arbitrary field assignments and move instructions at the same time as the garbage collector tries to clean up the heap, mutual bookkeeping between the program and the garbage collector is needed. Ultimately this means synchronization, and synchronization, even in a smart algorithm, means stopping the world. Stopping the world for short periods of time is necessary for all languages where garbage collection and heap management is involved. This is one of the main sources of latencies and non-determinism in a runtime.
Garbage collection may move objects around on the heap, for example by compaction. If a register in a thread context of a running program contains a pointer to an object and that object is moved to another location in memory, it is easy to realize that the program will break if it is just allowed to continue running without the GC updating the register contents in the thread context. This is done by synchronously modifying the thread context of the executing thread. The same applies to any object reference that points out an object on the heap whose address has changed as an effect of the garbage collection.
The easy way out would be to stop the world for a long period of time and just brute force garbage collect as much as possible with as many threads as possible. Before resuming the threads, all registers are updated. Normally, however, this isn't possible because low latencies are usually the main requirement for a modern server-side application. It doesn't do to halt execution for hundreds of milliseconds at a time. Thus, for low latency environments, which seek to minimize application response time, the garbage collector needs to do as much work as it can while the Java program is still running, and still handle these possible pointer reassignments. This is the difficult part. However, there is no getting around stopping the world completely at some point, unless the application has very special behavior. The real challenge is keeping these pauses as short as possible.
As we have discussed earlier, the virtual machine needs to provide some information to the memory system so that it can identify which positions on a local stack frame contain objects. This is needed to build the root set of objects that will form the first nodes of the live object graph. Every thread that is executing Java code handles objects, and if the thread is stopped, we need to know where in its context they are.
It is easy to identify objects in fields of other objects, as all object layouts are known to the garbage collector. If all instances of object X contain a field of type Y, the pointer to the field contents of Y for all X instances is always at the same offset from the start of an X instance. An object is little more than a C struct to the JVM. However, the GC doesn't automatically know where objects are on a stack frame.
Finding the method in which a particular thread has stopped is simple. We can just use a lookup table or search tree to find out in which Java method an instruction pointer belongs. Objects occur in the scope of this method, either present from the beginning of its execution as in-parameters, or as the result of field loads or function calls in the method. Move instructions may also copy objects from one register to another. Given an arbitrary point in the code of the method, the point where the execution has been halted, there is no way to backtrack the context where the thread is stopped to the context in which these objects were created. We have no way of knowing which code was just executed to get us to this particular address. However, the GC must, given a stack frame, know where objects are stored to form a correct root set.
Trivially, one might tell the compiler to only use certain registers and positions on the local stack frame for objects and certain other registers and positions for non-objects, such as integers. For example on x86, one might force the code generator to place objects only in the registers esi and edi and integers only in all other registers. One might spill objects only to stack positions whose offsets are even multiples of the pointer size ([esp+0*4], [esp+2*4] and so on) and integers only to stack positions that are odd multiples ([esp+1*4], [esp+3*4] and so on). This makes it simple for the GC, as our "objects only" locations can only contain a valid object or null. Other locations need not be processed by the GC at all, as they never contain objects. However, limiting the number of registers for generic use by the compiler requires the register allocator to produce more spills. This is completely impractical for performance reasons, especially on architectures like x86, where the amount of available general purpose registers is limited.
One way to get around this is to use a conservative garbage collector, treating every location that looks like an object pointer as an object pointer. Trivially, values like 17 and 4711 can be disregarded and are known to be integers, but values that look like addresses must be examined and checked against the heap. This produces overhead, and is necessary if we want to add automatic memory management to some languages, such as C, which is weakly typed. Conservative garbage collectors also have problems with unintentional object retention to varying degrees and with moving objects in memory.
In Java, however, we can get by with an exact garbage collector that knows precisely where object pointers are and where they are not. We only need a way to get this information to the garbage collector. Typically, this is done by generating meta info along with code for a Java method.
In JRockit, a piece of meta info that consists of a collection of registers and stack positions containing objects at a given program point is called a livemap. An additional bit of info per object pointer tells us whether it is an internal pointer or the actual start of an object. Internal pointers refer to some piece of information inside an object, thus pointing to the heap, but not to an object header. Internal pointers need to be tracked as they must be updated along with their base object if it is moved in memory, but they cannot be treated as base objects themselves.
A typical example of the use of internal pointers is when iterating through an array. In Java no internal pointers to objects may exist, but compiled code may well run faster if a sequence like:
for (int i = 0; i < array.length; i++) {
sum += array[i];
}
were to be compiled to native code equivalent to:
for (int ptr = array.getData();
ptr < sizeof(int) * array.length;
ptr += sizeof(int)) {
sum += *ptr;
}
In this case, the GC has to know that ptr is an internal pointer to the array so that it can be updated as well if array is moved to another position in memory. The code potentially runs faster since the pointer to the array element data need not be computed at every iteration in the loop.
So, it is clear that object pointers and internal object pointers need to be stored in meta info, livemaps, for the garbage collector. To illustrate how this information looks to the memory system, the following is a small example of compiled Java code in JRockit annotated with livemap info. The code example is a simple method that computes the sum of the elements of an array.
public static Integer sum(Integer array[]) {
Integer sum = 0;
for (int i = 0; i < array.length; i++) {
sum += array[i];
}
return sum;
}
Letting JRockit generate the method on a 64-bit x86 platform produces the following assembly code:
|
| |
|
|
|
Though it is not important to understand what the code generator has done here in detail, the main idea is that several program points in the assembly code are annotated with liveness information. In this case, the optimization level is not sufficiently high to generate the inner pointer pattern described earlier. Also, the calls to Integer.valueOf have not been inlined.
The livemap information under annotated operations tells the garbage collector which registers and stack positions contain objects at the given program point. Notice, for example, that the calls to Integer.valueOf, by calling convention always return a new integer object in rsi (the b after rsi means "base pointer" as opposed to "internal pointer").
The livemaps also tell us that rsi and rbx contain objects after the frame entry at the beginning of the method. This follows from the mov rbx, rsi at address 7a8c96, which is a register allocator artifact that shuffles the in-parameter from register rsi to register rbx.
Note
As rbx, in the JRockit calling convention is callee save (not destroyed over calls), the compiler chooses, for efficiency reasons, to keep the object alive in a register over the calls to Integer.valueOf. This way, the register allocator avoids doing a spill.
So, where can the garbage collector stop the world? Intuitively, it is too expensive to tag every single native instruction, each being a potential thread suspension point, with liveness information. As can be seen from the previous example, this is neither the case.
In JRockit, only certain instructions are tagged with livemaps, for example loop headers or headers of basic blocks with multiple entries, where it isn't possible to know which way control flow took to get there. Another example of instructions annotated with livemaps are call instructions. This is because liveness information must, for execution speed, be available immediately when computing a stack trace.
Recall from Chapter 2 that JRockit performs tasks like back patching calls. This means that the JVM must be equipped with a mechanism to understand and decompile native code. Originally, this mechanism was extended to make it possible to also emulate all native instructions from an address, given an operating system thread context as a starting point. If a livemap wasn't available at a certain instruction pointer in the context of a stopped thread, JRockit simply emulated the code, instruction by instruction, from that position until a livemap was reached. This is called rollforwarding.
Note
Rollforwarding was abandoned with JRockit R28. JRockit now uses a more traditional safepoint-based approach.
The advantages to this approach were that threads could be stopped anywhere. This was implemented using the signaling mechanisms of the underlying operating system. No extra instructions in the generated code were required.
The disadvantages were that emulation still took time and that large emulation frameworks needed to be in place, one for each supported hardware architecture. This was extremely difficult to test, as the set of inputs was virtually infinite, and emulation itself was very error prone. In addition, porting to a new hardware architecture became very expensive, requiring the implementation of a new complete emulation framework for that particular piece of silicon. Bugs in the emulators were usually subtle and generated intermittent and hard-to-find problems.
Throughout the years, there were also several problems with the signaling approach to stopping threads. It turns out that certain operating systems, especially Linux, seem to be poorly tested when it comes to applications that use a lot of signals. There were also issues with third-party native libraries that did not respect signal conventions, causing signal collisions. The external dependency on signals proved too error-prone to be completely reliable.
Newer versions of JRockit use a more traditional safepoint approach instead. Throughout the code, safepoint instructions that dereference a certain guard page in memory are inserted. At these instruction pointers, a complete livemap is always guaranteed to be in place. Whenever a Java thread is to be stopped, the runtime protects the guard page from access. This makes the safepoint instruction trigger a fault when executed. Variants of this technique are, as far as we know, employed in all commercial JVMs today. Loop headers are a typical example of program points where it makes sense to place safepoint instructions. We cannot allow a situation where the program will continue executing without ever trying to dereference a guard page. Thus, constructs like potentially infinite loops cannot be left without safepoint instructions.
The disadvantage here is that explicit code for dereferencing the guard page has to be inserted in the generated code, contributing to some execution overhead. But the advantages easily pay for this small inconvenience.
By now we have covered a lot of material on garbage collection, but only the basic concepts and algorithms. We've also discussed the surprisingly difficult problem of generating root sets for our garbage collectors. We will now attempt to cross the bridge to the "real world" and move on to discuss how garbage collection can be optimized and made more scalable.
In object-oriented languages, a very important observation is that most objects are temporary or short-lived.
For temporary objects, escape analysis at compile time might be able to stop them from being allocated on the heap altogether, but in an imperfect world this is not always possible. Especially in a language like Java.
However, performance improvements for handling short-lived objects on the heap can be had if the heap is split into two or more parts called generations. New objects are allocated in the "young" generations of the heap, that typically are orders of magnitude smaller than the "old" generation, the main part of the heap. Garbage collection is then split into young and old collections, a young collection merely sweeping the young spaces of the heap, removing dead objects and promoting surviving objects by moving them to an older generation.
Collecting a smaller young space is orders of magnitude faster than collecting the larger old space. Even though young collections need to happen far more frequently, this is more efficient because many objects die young and never need to be promoted. Ideally, total throughput is increased and some potential fragmentation is removed.
JRockit refers to the young generations as nurseries.
While generational GCs typically default to using just one nursery, sometimes it can be a good idea to keep several small nursery partitions in the heap and gradually age young objects, moving them from the "younger" nurseries to the "older" ones before finally promoting them to the "old" part of heap. This stands in contrast with the normal case that usually involves just one nursery and one old space.
Multi generation nurseries may be more useful in situations where heavy object allocation takes place.
We assume that the most freshly allocated objects will live for a very short period of time. If they live just a bit longer, typically if they survive a first nursery collection, the standard behavior of a single generation nursery collector, would cause these objects to be promoted to the old space. There, they will contribute more to fragmentation when they are garbage collected. So it might make sense to have several young generations on the heap, with different age spans for young objects in different nurseries, to try to keep the heap holes away from the old space where they do the most damage.
Of course the benefits of a multi-generational nursery must be balanced against the overhead of copying objects multiple times.
In generational GC, objects may reference other objects located in different generations of the heap. For example, objects in the old space may point to objects in the young spaces and vice versa. If we had to handle updates to all references from the old space to the young space on GC by traversing the entire old space, no performance would be gained from the generational approach. As the whole point of generational garbage collection is only to have to go over a small heap segment, further assistance from the code generator is required.
In generational GC, most JVMs use a mechanism called write barriers to keep track of which parts of the heap need to be traversed. Every time an object A starts to reference another object B, by means of B being placed in one of A's fields or arrays, write barriers are needed. Write barriers consist of a small amount of helper code that needs to be executed after each field or array store in the executing Java code.
The traditional approach to implementing write barriers is to divide the heap into a number of small consecutive sections (typically about 512 bytes each) that are called cards. The address space of the heap is thus mapped to a more coarse grained card table. Whenever the Java program writes to a field in an object, the card on the heap where the object resides is "dirtied" by having the write barrier code set a dirty bit.
Now, the traversion time problem for references from the old generation to the nursery is shortened. When doing a nursery collection, the GC only has to check the portions of the old space represented by dirty cards.
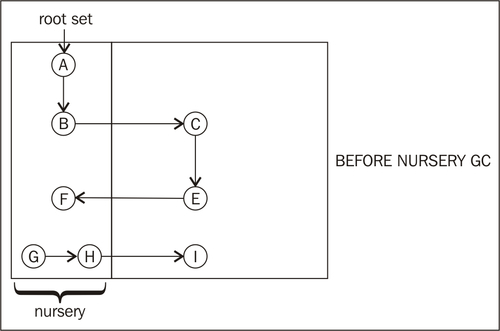
Consider the previous figure. The runtime is about to do a nursery collection. If the root set contains object A only, at the start of the collection, we would easily detect A and B as live by pointer tracing A to B. The pointer trace from B to C would be ignored, as C is in the old space. However, for the GC to work, we must add E in the old space to the root set, as it references an object in the nursery. With write barriers, we don't have to go over the entire old space to find E, but we just have to check the areas of the old space that correspond to dirty cards. In this example, the card for E was dirtied by the write barrier code after a previous assignment of F to a field in E. Thus, we can add F to the set of objects to be traced by the nursery GC.
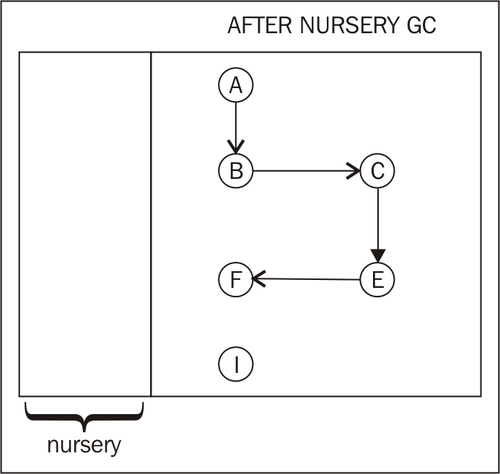
A and B are root reachable and will be promoted to the old space after the nursery collection. G and H are not, and will be garbage collected. E and F were root reachable, and thus F will be promoted. While I is dead, it is part of the old space and won't be handled until the next old collection. The following figure shows the heap after the completed nursery collection and promotion. The objects in the old space are untouched, as this was a nursery collection.
Recollect from Chapter 2 that the main factor that the JVM wants to minimize is the total runtime. In code generation, the total runtime is defined by the time to compile the code plus the time to execute the code. As we saw, we can only minimize one factor at the cost of another.
In memory management, the equation is simpler. All time spent in GC is of course detrimental to runtime. Minimizing the time spent in GC might seem the proper and only solution to lower the total runtime.
However, recollect that garbage collection requires stopping the world, halting all program execution, at some stage. Performing GC and executing Java code concurrently requires a lot more bookkeeping and thus, the total time spent in GC will be longer. If we only care about throughput, stopping the world isn't an issue —just halt everything and use all CPUs to garbage collect, one part of the heap per CPU. However, to most applications, latency is the main problem, and latency is caused by not spending every available cycle executing Java code.
Thus, the tradeoff in memory management is between maximizing throughput and maintaining low latencies. In an imperfect world, we can't expect to have both.
In some cases, latencies do not matter at all in an application, for example, in offline jobs that do large amounts of object crunching. A batch job running overnight may not be as vulnerable to response times as a client/server application.
If pause times up to several seconds are permissible, throughput can be maximized to a degree that is not possible if low latency is critical.
There are many variants of high throughput GC. The simplest approach is to stop the world and then garbage collect the heap with as many threads as possible, at least as many as the number of cores on the platform, each handling a separate part of the heap. Naturally, some synchronization between GC threads is still required for references that point to other heap parts. JRockit refers to this as parallel garbage collection.
We can still achieve levels of throughput not attainable in a low latency environment with other, less intrusive variants of this parallel approach. One example would be by using generations in the heap.
Optimizing for low latencies is basically a matter of avoiding stopping the world, and therefore also Java execution, by any means necessary. But naturally, if the garbage collector gets too little total CPU time and it can't keep up with the allocation frequency, the heap will fill up and an OutOfMemoryError will be thrown by the JVM. We need a GC that performs large parts of its work when the program is running.
JRockit refers to this kind of GC as concurrent garbage collection, using a term from one of the first scientific papers describing this technique, by Boehm and others. Later, the term mostly concurrent was introduced for improved versions of this algorithm.
Note
There is a slight degree of confusion in the terminology here. The parallel, throughput oriented GC, described in the previous section, does not run at the same time as the Java program executes. It is known as "parallel" because it uses as many threads as possible in parallel to garbage collect the heap. Garbage collection that runs at the same time as the Java program executes, as described in this section, is known as concurrent GC.
The concurrent garbage collector is also parallel, in the traditional meaning of the word, because it uses several worker threads. However, the terms concurrent and parallel used in the manner of this book are not just specific to JRockit. This is often the standard way of referring to these respective GC techniques in academic research and other commercial implementations.
Many stages of a mark and sweep garbage collection algorithm can be made to run concurrently with the executing Java program. Marking is the most critical of the stages, as it usually takes up around 90 percent of the total garbage collection time. Fortunately, marking is very parallelizable and large parts of a mark phase can also be run concurrently with executing Java code. Sweeping and compaction, however, tend to be more troublesome, even though it is fairly simple to compact parts of the heap while others are swept, thus achieving better throughput.
The main idea behind mostly concurrent garbage collection is to spend as much time running garbage collection as possible, while the Java program still executes. Throughout the GC cycle, several shorter stop the world phases are used, where some merely seek to synchronize the GC with the object graph, as the running Java program continuously makes changes to it. This is trivially not an issue if no Java execution is allowed to take place during GC. As far as we know, all commercial JVMs use variants of the mostly concurrent approach for low latency garbage collection.
The section on Near-real-time garbage collection, later in this chapter, goes into further details on how to achieve both performance and low latencies. And specifically, how JRockit does it.
The backbone of the GC algorithm used in JRockit is based on the tri-coloring mark and sweep algorithm described earlier in this chapter. However, several optimizations and improvements have been made to make it more parallel, both to enable it to run at the same time as the Java program is executing and to use an optimal number of threads. For nursery collections, heavily modified variants of stop and copy are used.
Garbage collection in JRockit can work with or without generations, depending on what we are optimizing for. Garbage collection strategies and adaptive implementation thereof is covered later in this chapter.
Note
The JRockit garbage collector can chose to tag any object on the heap as pinned for a shorter or longer period of time. This makes concurrent garbage collection algorithms more flexible. It can also enable I/O performance in that things like buffers can be kept in the same place on the heap for an entire I/O operation. This makes memory-intensive operations significantly faster. Pinned objects are a relatively simple concept in a GC, but for some reason, JRockit seems to be one of the few commercial JVMs that implements it.
The mark and sweep algorithm that is the fundament of all JRockit garbage collectors, parallel or concurrent, uses two colors and not three, for its objects, but still allows for efficient parallelization in the manner described in the section on Mark and sweep earlier in this chapter. Objects belong to one of two sets. One set is used to mark live objects. JRockit calls this set the grey bits, even though it is actually the semantic equivalent of a mix of grey and black objects in traditional tri-coloring. The distinction between grey and black objects is instead handled by putting grey objects in thread local queues for each garbage collecting thread. This approach has two advantages. First of all it allows parallel threads to work on thread local data instead of competing for a synchronized common set. Furthermore, it is possible to efficiently use prefetching on the contents of the queues as their elements are accessed both in FIFO order and close in time to one another. The general advantages of prefetching in memory management will be discussed later in this chapter.
For concurrent collectors in JRockit, an additional set called the live bits is used. It keeps track of all live objects in the system, including the newly created ones. This makes it possible for JRockit to quickly find objects that have been created during a concurrent mark phase, that is one running at the same time as the Java application.
JRockit uses a card table not only for generational GCs, but also to avoid searching the entire live object graph when a concurrent mark phase cleans up. This is because JRockit needs to find any new objects that may have been created by the running program during that mark phase. Recollect that write barriers in the running code continuously update the card table. The card table also has one card per region in the live object graph. As described, a card can be dirty or clean and all cards where objects have been newly created or have had their object references modified are marked as dirty. At the end of a concurrent mark phase, JRockit only needs to look at the dirty cards and scan the objects in the corresponding heap regions that have their live bit set. This guarantees that all objects, freshly allocated and old ones, are found even after a concurrent mark phase.
For nursery collections, JRockit uses a variant of stop and copy. All threads are halted, and all objects in the nursery are copied or promoted to the old space.
The copying is done hierarchically in breadth first manner, which increases cache locality (objects that reference each other should be stored close to each other in memory for maximum cache efficiency). The breadth-first copy algorithm is parallelizable in a way that automatically contributes to good load balancing.
Only live objects are copied to the old space. Instead of having to scan the entire heap to find out what objects in the nursery are live, the young collection uses the live bits and the card table that were mentioned in the previous section. As we start out with an empty nursery and because all objects that have their references updated get the corresponding card in the card table marked as dirty by write barrier code, all live objects in the nursery can be found by merely scanning objects that have their live bit set in a region corresponding to a dirty card.
Nursery collections in JRockit are always parallel but never concurrent. However, for efficiency reasons, young collections may occur at any time during a concurrent old collection. This complicates matters, especially because both the young collection and the old collection depend heavily on the same data structures.
However, it turns out that these data structures, the bit sets and the card table, can be shared as long as an old collection is guaranteed to see all cards that have become dirty during a concurrent phase. This is achieved by having an extra card table that records all dirty cards from the original card table. JRockit calls this union of all card table changes the modified union set. The nursery collection is free to process and clear dirty cards as long as the modified union set is kept intact for the old collection. So the young and old collector can operate at the same time without getting in the way of each other.
JRockit also uses a concept called keep area. The keep area is a region in the nursery where objects are not copied to old space during a young collection. By making sure that the youngest objects are allocated in the keep area, JRockit can ensure that newly created objects have an extra chance to become garbage collected before they are considered long lived, and copied to old space. This is the rough, simpler, equivalent to a multi-generational approach.
One thing that sets JRockit apart from the HotSpot VM is the lack of a permanent generation on the heap. In HotSpot, a heap part of predefined size, the permanent generation, is used to store metadata about, for example, class objects. Once the data is in the permanent generation, the default behavior is that it remains there forever (this might vary between garbage collection policies). This means that if a large amount of classloading takes place, the permanent generation will fill up and OutOfMemoryErrors will be thrown. We have seen customer cases, where the problem with a permanent generation gets so bad that the JVM and the Java application have to be restarted regularly.
JRockit is different in that it stores metadata off the heap in native memory instead. Code buffers for generated methods along with metadata pointed to by ClassLoaders that are no longer used are also constantly garbage collected. The problem of running out of memory for metadata in JRockit is not that different from the same problem in HotSpot, except for the fact that it is native memory instead of heap memory. There are, however, two significant differences. Firstly, in JRockit, cleaning up stale metadata is always enabled by default and secondly, there is no fixed size limit for the space used to store metadata. One of the larger problems with HotSpot is probably that intuitively, it is very hard to pick a size for the permanent generation. Is 128 MB enough? No? What about 256 MB? It is really very difficult to know for any given application. JRockit, being completely dynamic in its metadata allocation, need not consider size limits. It will, out of the maximum amount of native memory, allocate as much space as it needs for its metadata at any given time.
In JRockit, compaction is always single-threaded and non-concurrent. However, for parallel collectors, compaction runs at the same time as the sweep phase. As compaction is always done with a single thread, it is important that it is fast and that the time spent doing compaction can be controlled. JRockit limits compaction time by only compacting a part of the heap in each garbage collection. Most of the time, heuristics are used for choosing where on the heap to compact, and how much. The heuristics are also used to decide between different types of compactions—internal compaction just within one heap partition or external compaction (also referred to as evacuation) between different areas on the heap.
In order to make it more efficient to update all references to an object when it is moved, JRockit lets the mark phase keep track of all references that point to objects inside a heap region that is to be compacted. This information can also be used to determine if it is possible to do any compaction at all or if certain popular objects should be excluded from compaction as too many other objects reference them.