The easiest way to both control the life cycle of recordings and transfer whole or parts of recordings to JRockit Mission Control, is to do everything from inside the JRockit Mission Control client.
Starting a JRA-style time-bound recording is quite similar to how it was done in previous JRockit versions, using JRA—simply right click on the JVM in the JVM Browser, and then click on Start Flight Recording....

In JRockit Mission Control 4.0, two things will happen:
- The Start Flight Recording wizard dialog box will open.
- The Flight Recorder Control view will open.
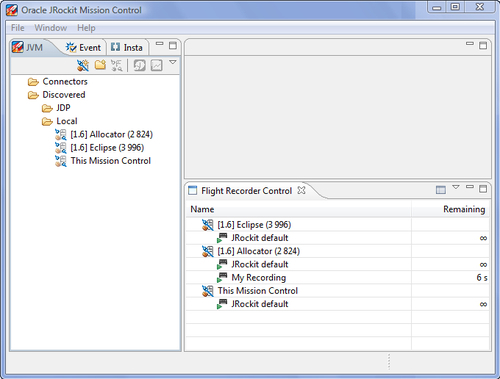
The Flight Recorder Control view is new for JRockit Mission Control 4.0. It shows the recordings available for one or more connections, and can also be used for controlling the recordings. It is quite useful for checking if any recordings are already running in the JVM. In the following screenshot, the continuous recording is already running:
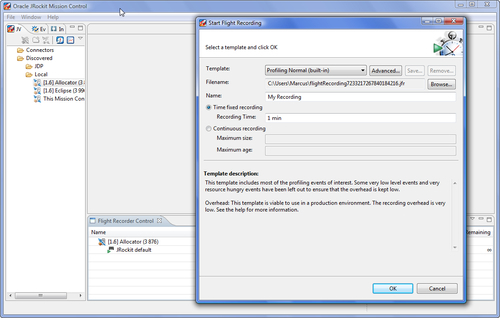
Similar to JRA, this wizard contains a few built-in templates to choose from, and if none of the provided templates records the information of interest, new templates can be created. These templates differ from the server-side templates in that they are fully resolved (no wildcards anywhere), and in that they support metadata for the user interface.
The default built-in client-side templates are:
- Default Profiling: A good, general-purpose profiling template with low profiling overhead.
- Profiling with Locks: Same as the previous one, but with lock profiling enabled. This requires the JRockit instance that is to be profiled to be started with
-XX:+UseLockProfiling. This, in turn, causes some additional overhead, even when not recording. - Profiling with Exceptions: Same as the Default Profiling template, but with exception profiling enabled. For most applications, the overhead of this template will not be different from that of the Default Profiling template. However, for some pathological applications, where a large number of exceptions are thrown, the overhead can be considerable.
- Real-Time: Focuses on garbage collection related events, but leaves out some of the most resource hungry events.
Worth noting is that both the default client-side and server-side templates omit exception events by default, as it is difficult to estimate their performance impact on a pathological application. To include exception profiling, select the built-in Profiling with Exceptions template. Exception profiling will be further discussed later in this chapter.
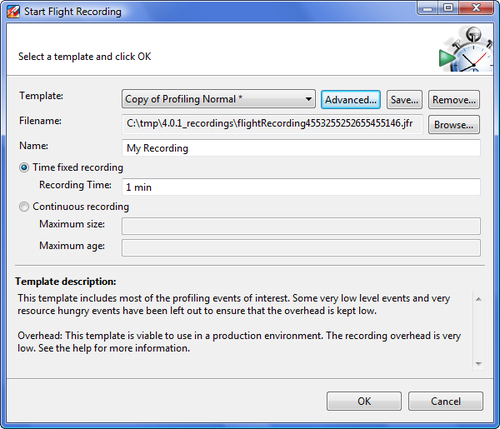
Once a suitable template is selected, a destination file must be specified, and an appropriate name chosen. Some event producers, such as the ones from the WebLogic Diagnostics Framework, have their own recordings running. In a large system, there can be quite a few recordings running in parallel. Naming the recording properly will make it easier to find it later.
Note
Not only the JVM can record events in the Flight Recorder. There are already event producers for the Oracle WebLogic Diagnostics Framework (WLDF) and the Oracle Dynamic Monitoring System (DMS). We expect more Oracle products to provide producers in the future, such as JRockit Virtual Edition.
It is possible to perform either a time-limited recording or a continuous one. For a time-limited recording, a duration must be chosen. In order to limit the resource usage of continuous recordings, it is possible to limit the amount of data to store, either by time, size, or both.
Once the recording wizard is filled out, clicking on Continue will start the recording.
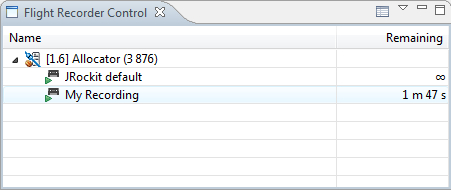
The Flight Recorder Control view is updated to show the newly started recording. For time-limited recordings, the remaining time until the recording is done is shown and periodically updated. Continuous recordings show an infinity (∞) sign instead of the remaining time.
Note that there is a table settings action (![]() ) in the toolbar of the Flight Recorder control view. The table can be configured to show more information, if needed.
) in the toolbar of the Flight Recorder control view. The table can be configured to show more information, if needed.
For a time-limited recording, the recording will be downloaded automatically once it is complete.
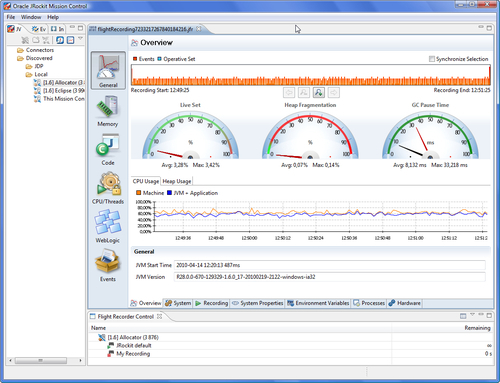
As can be seen in the previous screenshot, recordings are left on the server by default when completed, even after they have been downloaded. In the screenshot, My Recording has just been downloaded. It is also displayed as being finished (![]() ) in the Flight Recorder Control view, with no time remaining. Such finished recordings can be removed by right clicking on the recording in the Flight Recorder Control view and then clicking on Close.
) in the Flight Recorder Control view, with no time remaining. Such finished recordings can be removed by right clicking on the recording in the Flight Recorder Control view and then clicking on Close.
As mentioned, it is possible to see the recording activities of more than one JVM at a time in the Flight Recorder Control view. To add a connection to monitor, simply right click on the connection in the JVM Browser and then click on Show Recordings. The following screenshot shows the recordings for three different JVMs at once:
To use the control view to dump data from an ongoing recording, simply right click on it and select Dump.... This brings up the Dump Recording dialog, as shown in the following screenshot:
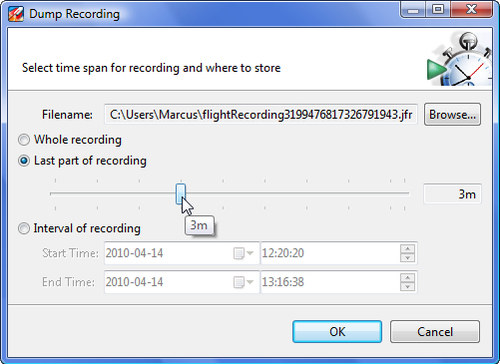
There are three different ways to select what part of the recording to dump:
- Whole recording: Dumps all available data.
- Last part of recording: Dumps the last data in the recording, given a specified period of time. Note that it is possible to get more data than was specified, as only whole data chunks will be dumped.
- Interval of recording: Dumps recording data for a specified interval of time. Note that the time is specified in server time. If the client is running in Stockholm and the server in Tokyo, make sure you specify the correct time. If there is no data within the specified time, an error message is displayed.
Again, what is actually dumped may be more than you were asking for.
The data is dumped in whole data chunks of a fixed size. Each chunk of data contains a constant pool that the events in the chunk use to resolve the data. For instance, there is a pool containing the stack traces for the events. When an event contains a stack trace, the event will refer to the stack trace by index in the pool. This way, the format can be streamed and used on a per-chunk basis, each chunk being self-contained.
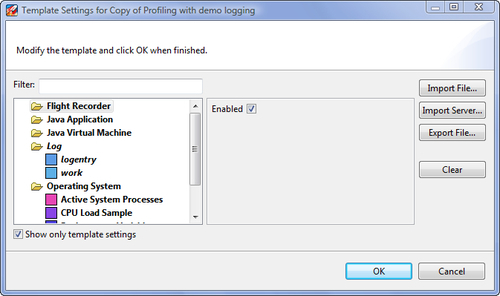
The Flight Recording Wizard lets you create custom templates. Clicking on the Advanced... button next to a template name brings up a dialog box where the template settings can be edited.
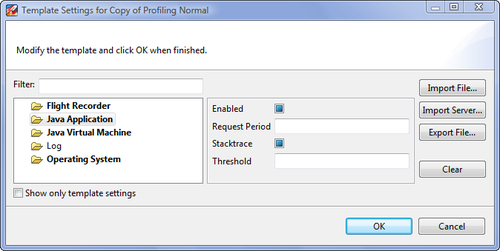
To the left in the wizard is an event type tree similar to the one in the Event Types view. Selecting a parent node will allow the settings to be changed recursively for all the descendants of that node. If there are different settings for the different children, no value is shown for that of the parent node. For example, in the previous screenshot, the settings for the events under the Java Application node vary, so no values are shown for the Request Period and Threshold. Also, it would seem that some events in the selection are disabled as well, as there is no check mark in the check box for Enabled. To enable all of the Java Application events, click on the Enabled check box.
In our example, the check box under the event type tree has been unchecked to allow event types that are not a part of the current template to be shown. Nodes with children that are part of a template are rendered in a bold faced font. Consequently, we can see that no event types under Log are part of the current template.
The event types shown in the tree depend both on what application is running in the JVM (the application may also utilize the Flight Recorder API) and on the settings in the template. This allows the user to change settings for event types originating in producers other than the default JRockit JVM producer. In the following example, an event producer with event types with a path beginning with Log is available in the running JVM.
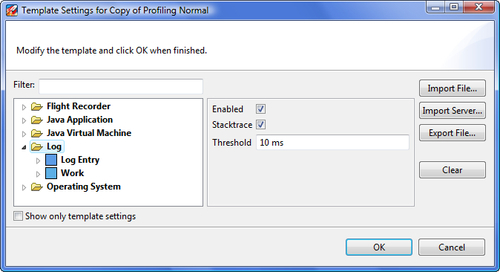
Updating the settings for event types will make them bold, indicating that they are now part of the template.
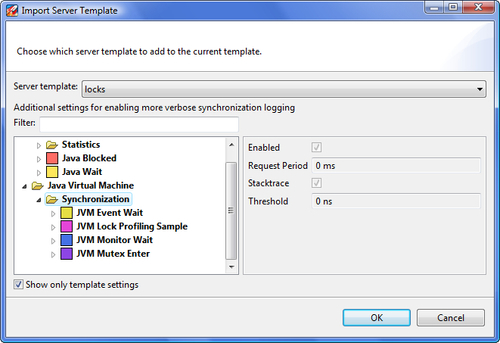
It is possible to import server-side templates from the advanced wizard. A good idea when doing so is to first clear the template from any interfering settings. To clear the template of all settings, click on the Clear button. The import functionality is additive, as the server-side templates are meant to be used in an additive fashion. This means that it is possible to, for example, start out with the settings for a default recording and then add lock profiling, by first importing the default template, and then importing the locks template. The next screenshot shows the import dialog:
Entering the advanced dialog creates a temporary working copy of the template. Clicking on OK will save the settings to this temporary copy. An asterisk (*) next to the template name indicates that the copy has not yet been stored. If the changes to the template were done for only this particular recording, the template changes need probably not be stored.
Simply clicking on OK in the Start Flight Recording dialog box allows the recording to commence without the template first being saved. The template will be available for the rest of the session, but gone the next time that JRockit Mission Control is started.
To save the template and give it a name and description, click on Save....
Once the recording is saved, it can be reused, even on JVMs that do not support all the event types for which the template has settings. For instance, when connecting to a JVM not supporting the log event types, a template containing settings for the log event types will render the log event types in italics, as shown in the following screenshot. As the template can be applied anyway, it is easy to store your favorite settings for a lot of different producers and scenarios in a small set of templates.