
This section covers the most important command-line flags that can be used to control and instrument JRockit lock behavior.
While plenty of information can be gleaned from log files using some of these flags, synchronization is a complex business and the preferred and best way to visualize multithreaded behavior is through the JRockit Mission Control suite.
This section explains the most important flags for studying and manipulating lock behavior.
This flag makes JRockit report information related to synchronization in the running program. Most of the information that the -Xverbose:locks flag produces has to do with the lazy unlocking optimization. This is a good way to see, for example, which types and objects are temporarily or permanently banned for lazy unlocking, or if lazy unlocking performs as efficiently as it should, without having to revert its assumptions all the time.
Following is a sample output from -Xverbose:locks. We can see that lazy unlocking is determined inappropriate for a couple of classes, whose instances are competed for by different threads. These classes are banned from further lazy unlocking.
hastur:SPECjbb2005 marcus$ java -Xverbose:locks -cp jbb.jar:check. jar spec.jbb.JBBmain -propfile SPECjbb.props >/dev/null
[INFO ][locks ] Lazy unlocking enabled
[INFO ][locks ] No of CPUs: 8
[INFO ][locks ] Banning spec/jbb/Customer for lazy unlocking. (forbidden 6 times, limit is 5)
[INFO ][locks ] Banning spec/jbb/Address for lazy unlocking. (forbidden 6 times, limit is 5)
[INFO ][locks ] Banning java/lang/Object for lazy unlocking. (forbidden 5 times, limit is 5)
[INFO ][locks ] Banning spec/jbb/TimerData for lazy unlocking. (forbidden 6 times, limit is 5)
[INFO ][locks ] Banning spec/jbb/District for lazy unlocking. (forbidden 6 times, limit is 5)
Depending on the platform and JRockit version, lazy unlocking may or may not be enabled out of the box. Please refer to the JRockit Documentation to find out what applies to a particular platform or study the output from -Xverbose:locks. Given that adaptive reversion strategies form part of the lazy unlocking algorithm, it is more often the case than not, that when enabled, lazy unlocking will contribute to increased performance.
The default lazy unlocking behavior can be overridden with the flag:
-XX:UseLazyUnlocking=false or -XX:UseLazyUnlocking=true.
Finally, -Xverbose:codegen will, as mentioned earlier in the chapter, output warnings for any method where the compiler failed to create matched locks and unlocks.
Issuing a SIGQUIT signal to a JRockit process, typically by executing kill QUIT <PID> or kill -3 <PID> in *NIX environments or by pressing Ctrl-Break in a console window on Windows, will dump complete stack traces (where available) for all the threads in the JVM, both native and Java threads. The locks taken by the threads are also displayed, along with their types. This is a "poor man's way" of quickly detecting deadlocks, by finding out if a thread is waiting for a resource held by another suspended thread.
Following is an example thread dump including lock holders, what type of lock they are holding and where on the execution stacks the locks were taken:
===== FULL THREAD DUMP ===============
Tue Jun 02 14:36:39 2009
BEA JRockit(R) R27.6.3-40_o-112056-1.6.0_11-20090318-2104-windows-ia32
"Main Thread" id=1 idx=0x4 tid=4220 prio=5 alive, in native, sleeping, native_waiting
at java/lang/Thread.sleep(J)V(Native Method)
at spec/jbb/JBButil.SecondsToSleep(J)V(Unknown Source)
at spec/jbb/Company.displayResultTotals(Z)V(Unknown Source)
at spec/jbb/JBBmain.DoARun(Lspec/jbb/Company;SII)V(Unknown Source)
at spec/jbb/JBBmain.runWarehouse(IIF)Z(Unknown Source)
at spec/jbb/JBBmain.doIt()V(Unknown Source)
at spec/jbb/JBBmain.main([Ljava/lang/String;)V(Unknown Source)
at jrockit/vm/RNI.c2java(IIIII)V(Native Method)
-- end of trace
"(Signal Handler)" id=2 idx=0x8 tid=1236 prio=5 alive, in native, daemon
"(GC Main Thread)" id=3 idx=0xc tid=5956 prio=5 alive, in native, native_waiting, daemon
"(GC Worker Thread 1)" id=? idx=0x10 tid=5884 prio=5 alive, in native, daemon
"(GC Worker Thread 2)" id=? idx=0x14 tid=3440 prio=5 alive, in native, daemon
"(GC Worker Thread 3)" id=? idx=0x18 tid=4744 prio=5 alive, in native, daemon
"(GC Worker Thread 4)" id=? idx=0x1c tid=5304 prio=5 alive, in native, daemon
"(GC Worker Thread 5)" id=? idx=0x20 tid=5024 prio=5 alive, in native, daemon
"(GC Worker Thread 6)" id=? idx=0x24 tid=3632 prio=5 alive, in native, daemon
"(GC Worker Thread 7)" id=? idx=0x28 tid=1924 prio=5 alive, in native, daemon
"(GC Worker Thread 8)" id=? idx=0x2c tid=5144 prio=5 alive, in native, daemon
"(Code Generation Thread 1)" id=4 idx=0x30 tid=3956 prio=5 alive, in native, native_waiting, daemon
"(Code Optimization Thread 1)" id=5 idx=0x34 tid=4268 prio=5 alive, in native, native_waiting, daemon
"(VM Periodic Task)" id=6 idx=0x38 tid=6068 prio=10 alive, in native, native_blocked, daemon
"(Attach Listener)" id=7 idx=0x3c tid=6076 prio=5 alive, in native, daemon
...
"Thread-7" id=18 idx=0x64 tid=4428 prio=5 alive
at spec/jbb/infra/Util/TransactionLogBuffer.privText (Ljava/lang/String;IIIS)V(UnknownSource)[optimized]
at spec/jbb/infra/Util/TransactionLogBuffer.putText (Ljava/lang/String;IIIS)V(Unknown Source)[inlined]
at spec/jbb/infra/Util/TransactionLogBuffer.putDollars (Ljava/math/BigDecimal;III)V(Unknown Source)[optimized]
at spec/jbb/NewOrderTransaction.processTransactionLog() V(Unknown Source)[optimized]
^-- Holding lock: spec/jbb/NewOrderTransaction@0x0D674030[biased lock]
at spec/jbb/TransactionManager.runTxn(Lspec/jbb/Transaction;JJD) J(Unknown Source)[inlined]
at spec/jbb/TransactionManager.goManual(ILspec/jbb/TimerData;) J(Unknown Source)[optimized]
at spec/jbb/TransactionManager.go()V(Unknown Source)[optimized]
at spec/jbb/JBBmain.run()V(Unknown Source)[optimized]
at java/lang/Thread.run(Thread.java:619)[optimized]
at jrockit/vm/RNI.c2java(IIIII)V(Native Method)
-- end of trace
"Thread-8" id=19 idx=0x68 tid=5784 prio=5 alive, in native, native_blocked
at jrockit/vm/Locks.checkLazyLocked(Ljava/lang/Object;) I(Native Method)
at jrockit/vm/Locks.monitorEnterSecondStage(Locks.java:1225)
at spec/jbb/Stock.getQuantity()I(Unknown Source)[inlined]
at spec/jbb/Orderline.process(Lspec/jbb/Item;Lspec/jbb/Stock;) V(Unknown Source)[optimized]
at spec/jbb/Orderline.validateAndProcess(Lspec/jbb/Warehouse;) Z(Unknown Source)[inlined]
at spec/jbb/Order.processLines(Lspec/jbb/Warehouse;SZ) Z(Unknown Source)[inlined]
at spec/jbb/NewOrderTransaction.process()Z(Unknown Source)[optimized]
^-- Holding lock: spec/jbb/Orderline@0x09575D00[biased lock]
^-- Holding lock: spec/jbb/Order@0x05DDB4E8[biased lock]
at spec/jbb/TransactionManager.runTxn(Lspec/jbb/Transaction;JJD) J(Unknown Source)[inlined]
at spec/jbb/TransactionManager.goManual(ILspec/jbb/TimerData;) J(Unknown Source)[optimized]
at spec/jbb/TransactionManager.go()V(Unknown Source)[optimized]
at spec/jbb/JBBmain.run()V(Unknown Source)[optimized]
at java/lang/Thread.run(Thread.java:619)[optimized]
at jrockit/vm/RNI.c2java(IIIII)V(Native Method)
-- end of trace
"Thread-9" id=20 idx=0x6c tid=3296 prio=5 alive, in native, native_blocked
at jrockit/vm/Locks.checkLazyLocked(Ljava/lang/Object;) I(Native Method)
at jrockit/vm/Locks.monitorEnterSecondStage(Locks.java:1225)
at spec/jbb/Stock.getQuantity()I(Unknown Source)[inlined]
at spec/jbb/Orderline.process(Lspec/jbb/Item;Lspec/jbb/Stock;) V(Unknown Source)[optimized]
at spec/jbb/Orderline.validateAndProcess(Lspec/jbb/Warehouse;) Z(Unknown Source)[inlined]
at spec/jbb/Order.processLines(Lspec/jbb/Warehouse;SZ) Z(Unknown Source)[inlined]
at spec/jbb/NewOrderTransaction.process()Z(Unknown Source)[optimized]
^-- Holding lock: spec/jbb/Orderline@0x09736E10[biased lock]
^-- Holding lock: spec/jbb/Order@0x09736958[biased lock]
at spec/jbb/TransactionManager.runTxn(Lspec/jbb/Transaction;JJD) J(Unknown Source)[inlined]
at spec/jbb/TransactionManager.goManual(ILspec/jbb/TimerData;) J(Unknown Source)[optimized]
at spec/jbb/TransactionManager.go()V(Unknown Source)[optimized]
at spec/jbb/JBBmain.run()V(Unknown Source)[optimized]
at java/lang/Thread.run(Thread.java:619)[optimized]
===== END OF THREAD DUMP ===============
JRockit can produce extensive profiling information about each lock in a running program at the cost of some overhead. Typically, running with lock profiling adds about three percent or possibly more to the total runtime, depending heavily on the application.
For more information about analyzing lock profiling info, please see the chapters on JRockit Mission Control.
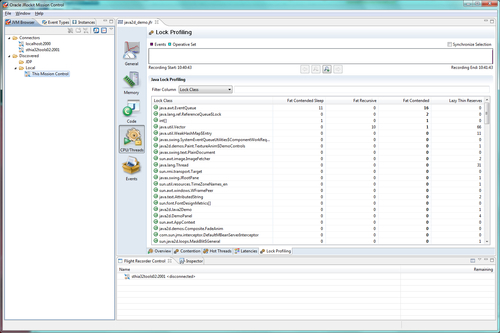
For more extensive information about where a Java application spends its time, the flag -XX:UseLockProfiling=true can be used. This will instrument all locks and unlocks in the Java program and store information under which condition it was taken and the number of times it has been in use. Lock profiling can be augmented with information on native locks inside the JVM, such as code buffer locks or locks taken by the garbage collector. In order to get this information as well, use the flag -XX:UseNativeLockProfiling=true.
JRockit Mission Control can be used to analyze any JRockit Flight Recording with lock profiling information. Any lock in the Java program (or JVM) can be studied in detail, revealing, for example, how many times it was thin, fat, contended, lazily reserved, recursive, and so on.
Following is a screenshot of the lock profiling tab in JRockit Mission Control:
For further information about generating and using lock profiling information, please consult the JRockit Documentation.
The lock profile can also be controlled through the JRCMD command-line instrumentation tool that is part of the JRockit JDK. Whenever JRockit is run with the lock profiling flag enabled, JRCMD will respond to the commands lockprofile_reset and lockprofile_print that will respectively clear all lock performance counters and dump them to the console.
A detailed explanation on how to use JRCMD and its diagnostic commands is given in Chapter 11, JRCMD.
The -Xss flag specifies how much stack each thread should be allocated. Thread stacks are the memory areas allocated for each Java thread for their internal use. This is where the thread stores its execution state. It normally makes little sense to increase this size, unless there is plenty of recursion or a large amount of stack local information. For example, -Xss:256k will set the thread stack size to 256 KB.
The default stack size varies between platforms. Please refer to the official JRockit Documentation to find the default stack size for a particular platform.
StackOverflowError(s) in a Java program might be resolved by using larger thread stacks, unless they are the product of infinite recursion.
Finally, there are several flags for controlling heuristics for the JRockit locks. One example would be the ability to disable the spinlock part of a fat lock (-XX:UseFatSpin=false) that is otherwise enabled by default. Another would be -XX:UseAdaptiveFatSpin=true that enables adaptive runtime feedback to adjust the behavior of the spinlock part of a fat lock. It is disabled by default.
There are also several default values for lazy unlocking heuristics, lock inflation, and lock deflation heuristics that can be modified. This is generally not needed. To satisfy the curious readers, some more advanced JRockit lock tweaks are described in Chapter 5, Benchmarking and Tuning. The JRockit documentation also contains information on all applicable command-line flags.