
Another way of using the Memleak tool is to validate a hypothesis about memory management in an application. Such a hypothesis could for example be "when I remove all contacts from my contact list, no Contact objects should be left in the system". Because of the interactive nature of the Memleak tool, this is a very powerful way of finding leaks, especially in an interactive application. A huge amount of such scenarios can be tested without interruptions caused by, for example, dumping heaps to files. If done well and with enough systems knowledge, finding the leaks can be a very quick business.
For example, consider a simple address book application. The application is a self-contained Swing application implemented in a single class named AddressBook. The class contains a few inner classes, of which one is the representation of a contact—AddressBook$Contact. In the application, we can add and remove contacts in the address book. One hypothesis we may want to test is that we do not leak contacts.
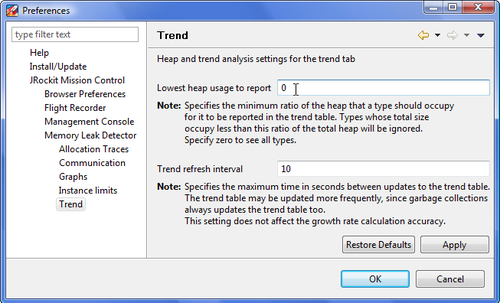
The Memleak tool normally only shows types that occupy more than 0.1 percent of the heap, or the amount of data in the general case would be overwhelming. We are normally not interested in types not heavily involved in leaks, and as time passes, the interesting ones tend to occupy quite a lot of the heap anyway. However, most leaks usually only occupy a tiny fraction of the heap until the leaking application has run for quite some time. In order to detect memory leaks earlier, this setting can be changed to 0 so that all types are shown, regardless of their used heap space. This can be done in the preferences, as shown in the following screenshot:
We then filter out the classes related to the hypothesis that we want to test and watch how they behave while we run the application.
Note
Remember from Chapter 7, The Management Console, that the filter boxes in JRockit Mission Control can use regular expressions by entering the prefix regexp.
In the following screenshot, three addresses have been removed from the AddressBook, but the number of Contact instances remain at the original eight:
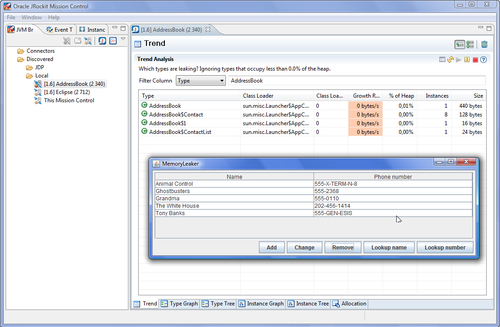
Removing all of them will still leave all eight of the original AddressBook$Contact instances in the system. There is indeed a memory leak.
Tip
To get the Memleak tool to react faster to the changes on the heap, the trend refresh interval (shown in the preference screenshot earlier) can be lowered.
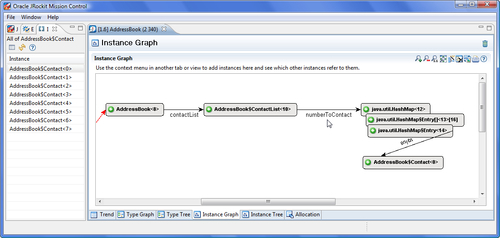
Now, as all the remaining instances are unintentionally retained, drilling down into any of them will be sufficient for tracking down the leak. Simply click on List all instances from the context menu in the trend table and then add any of the instances to the Instance Graph. The path to root referrer in the example reveals that the contacts are retained in some sort of index map named numberToContact. The developer of the application should be familiar with this structure and know where to look for it in the code. If we ensure that we remove the Contact objects from the index map as well as from the contact list, the leak will go away.
The recipe for interactively testing for memory leaks is:
- Formulate a hypothesis, such as "When I close my Eclipse PHP Editor, I expect the editor instance and the instances associated with it to go away".
- Filter out the classes of interest in the trend table.
- See how they are freed and allocated as the hypothesis is tested.
- If a memory leak is found, it is usually quite easy to find a leaking instance and locate the problem by tracing the path to the root referrer.