
There are various ways to access the JRockit management features programmatically, all of them more or less unsupported. As the APIs in question are unsupported, they are subject to change between JRockit releases or even to disappear entirely. This means that dependencies on these APIs may break between releases of JRockit. Because the APIs can be quite useful, this chapter will nevertheless show a few different ones, with their applications.
In this chapter, you will learn:
- How to use the JRockit Management API (JMAPI) to access runtime information in the JRockit JVM
- How to instantiate and access the JMX-based JRockit Management API (JMXMAPI) for various versions of JRockit
The first API we will discuss is called JMAPI, short for the JRockit Management API. It is a lightweight Java-only API which provides in-process access to various management features. This API has existed since very early versions of JRockit. However, parts of the API were marked as deprecated in R28.0.0 and its future is uncertain.
JMAPI was the JVM-side API that enabled the functionality of the earliest versions of the JRockit Management Console. In fact, even today, if a connection is established to a 1.4 version of JRockit, a proprietary internal protocol called the Rockit Management Protocol (RMP) will be used. This protocol will, in turn, use JMAPI to gather data and change the various runtime parameters of the JVM.
The next few pages contain various examples of things that can be done using JMAPI. The easiest way to compile the examples is to use the JRockit JDK. This requires no special configuration, as the necessary classes are available in the JRockit rt.jar that is part of the JRockit JDK. The examples can also be compiled by including jmapi.jar, that contains all the interface declarations, in your class path. The jmapi.jar is not part of the JDK, but is distributed by Oracle on request.
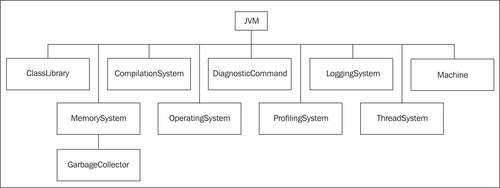
Using JMAPI for simple tasks is very easy. Use the com.bea.jvm.JVMFactory class to get an instance implementing the JVM interface. From the JVM interface a number of different subsystems can be reached.
Note
For readers who reacted on the com.bea part in the package name—JMAPI predates the 2008 Oracle acquisition of BEA Systems, and is used in other Oracle products as well as in third-party products. As JMAPI was supported in JRockit R27 and earlier releases, the package name cannot be changed without breaking existing products utilizing JMAPI.
Let us begin with a simple example that writes the current CPU load on the console ten times with a one second delay between each printout:
import com.bea.jvm.JVMFactory;
public class JMAPITest {
public static void main(String[] args) throws InterruptedException {
for (int i = 0; i < 10; i++) {
System.out.println( String.format("CPU load is %3.2f%%", JVMFactory.getJVM().getMachine().getCPULoad() * 100.0));
Thread.sleep(1000);
}
}
}
Access permissions to JMAPI are very coarse-grained; access is either permitted or not allowed at all. If the code needs access to JMAPI when a security manager is active, it must be granted the com.bea.jvm.ManagementPermission "createInstance".
The following security policy statement grants access to JMAPI for all code:
grant { permission com.bea.jvm.ManagementPermission "createInstance";
};
Note
For more information on how to use permissions and policies, see:
http://java.sun.com/j2se/1.5.0/docs/guide/security/permissions.html
JMAPI can be used to gather a lot of information about the operating environment. The following code example prints some information about the available network interfaces:
for (NIC nic : JVMFactory.getJVM().getMachine().getNICs()) {
System.out.println( nic.getDescription() + " MAC:" + nic.getMAC() + " MTU:" + nic.getMTU());
}
It is also possible to change various aspects of the runtime parameters using JMAPI. The following piece of code will attempt to change the JRockit process affinity to only one CPU:
private static void bindToFirstCPU(JVM jvm) {
Collection<CPU> cpus = jvm.getProcessAffinity();
CPU cpu = cpus.iterator().next();
Collection<CPU> oneCpu = new LinkedList<CPU>();
oneCpu.add(cpu);
jvm.suggestProcessAffinity(oneCpu);
}
This can be compared to using the command-line flag -XX:BindToCPUs, for controlling CPU affinity. The flag was introduced in Chapter 5, Benchmarking and Tuning.
Other aspects such as the pause time target, the heap size, and the nursery size can also be changed as follows:
MemorySystem ms = JVMFactory.getJVM().getMemorySystem();
ms.suggestHeapSize(1024*1024*1024);
ms.getGarbageCollector().setPauseTimeTarget(30);
ms.getGarbageCollector().setNurserySize(256*1024*1024);
Some features in JMAPI are a result of direct demands from customers with specialized setups. There is, in particular, one peculiar feature that comes to mind—it is possible to force the JRockit process to instantly terminate if it runs out of memory, instead of throwing an OutOfMemoryError.
ms.setExitOnOutOfMemory(true);
It is also possible to do simple method profiling using JMAPI. The following example enables profiling for the method java.io.StringWriter.append(CharSequence). The example executes it for a number of String instances, after which the number of invocations and the average time it took to invoke the method will be printed.
import java.io.StringWriter;
import java.lang.reflect.Method;
import com.bea.jvm.JVMFactory;
import com.bea.jvm.MethodProfileEntry;
import com.bea.jvm.ProfilingSystem;
public class MethodProfilerExample {
public static void main(String[] args) throws Exception {
String longString = generateLongString();
ProfilingSystem profiler = JVMFactory.getJVM() .getProfilingSystem();
Method appendMethod = StringWriter.class.getMethod(
"append", CharSequence.class);
MethodProfileEntry mpe = profiler .newMethodProfileEntry(appendMethod);
mpe.setInvocationCountEnabled(true);
mpe.setTimingEnabled(true);
String total = doAppends(10000, longString);
long invocationCount = mpe.getInvocations();
long invocationTime = mpe.getTiming();
System.out.println("Did " + invocationCount + " invocations");
System.out.println("Average invocation time was " + (invocationTime * 1000.0d) / invocationCount + " microseconds");
System.out.println("Total string length " + total.length());
}
private static String doAppends(int count, String longString) {
StringWriter writer = new StringWriter();
for (int i = 0; i < count; i++) {
writer.append(longString);
}
return writer.toString();
}
private static String generateLongString() {
StringWriter sw = new StringWriter(1000);
for (int i = 0; i < 1000; i++) {
// Build a string containing the characters
// A to Z repeatedly.
sw.append((char) (i % 26 + 65));
}
return sw.toString();
}
}
The previous example is slightly simplified. Normally, profiling could already have been enabled for the method, and thus the counter and timing information already available in the MethodProfileEntry should be stored before the profiling run is started and subtracted from the total when it is finished.
Recall the diagnostic commands that were introduced in Chapter 7, The Management Console and Chapter 11, JRCMD. All diagnostic commands are available through JMAPI, and can be accessed through the DiagnosticCommand subsystem. Here is an example that prints the object summary histogram on stdout, in effect programmatically executing the diagnostic command print_object_summary:
import com.bea.jvm.DiagnosticCommand;
import com.bea.jvm.JVMFactory;
public class ObjectSummary {
public static void main(String[] args)
throws InterruptedException {
DiagnosticCommand dc = JVMFactory.getJVM()
.getDiagnosticCommand();
String output = dc.execute("print_object_summary");
System.out.println(output);
}
}
Finally, JMAPI also contains powerful class pre-processing and redefinition features. The following example redefines the bytecode of the classes as they are loaded, by calling transformByteCode for each class:
ClassLibrary cl = JVMFactory.getJVM().getClassLibrary();
cl.setClassPreProcessor(new ClassPreProcessor() {
@Override
public byte[] preProcess(ClassLoader cl, String className, byte[] arg) {
System.out.println("Pre-processing class " + className);
return transformByteCode(arg);
}
});
There can only be one active preprocessor in use at any given time. By using the method redefineClass in the class library, it is also possible to redefine already loaded classes.