
Finding the cause of memory leaks can be very tricky, and tracking down complex leaks frequently involves using several tools in conjunction. The application is somehow keeping references to objects that should no longer be in use. What's worse, the place in the code where the leaked instance was allocated does not necessarily have to be co-located with the place in the code pertaining to the leak. We need to analyze the heap to find out what is going on.
To start Memleak, simply select the JVM to connect to in the JVM Browser and choose Memleak from the context menu.
In Memleak, the trend table can help detect even slow leaks. It does this by building a histogram by type (class), and by collecting data points about the number of instances of every type over time. A least squares approximation on the sizes over time is then calculated, and the corresponding growth rate in bytes per second is displayed.
Note
In JRockit Mission Control 4.1.0, this algorithm will be a little bit more sophisticated, as it will also incorporate the correlation to the size of the live set over time. The types that have the highest tendency to grow as the live set is growing are more likely to be the ones causing a leak.
The trend table can usually be helpful in finding good candidates for memory leaks. In the trend table, classes with a high growth rate are colored red—higher color intensity means higher growth rate. We can also see how many instances of the class there are, and how much memory they occupy.
In the program being analyzed in the following example, it would seem that char arrays are leaking. Not only are they colored deep red and at the top of the trend analysis table, signifying a suspected memory leak, but they also have the one of the highest growth rates of any type in the system.
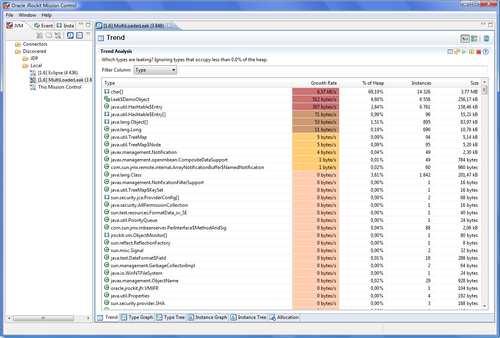
It would also seem, to a lesser extent, that classes related to the types Leak$DemoObject and Hashtable are leaking.
In total, we seem to be leaking about 7.5 KB per second.
(6.57*1,024+512+307+71+53+11)/1,024 ≈ 7.5
The JVM was started with a maximum heap size of 256 MB, and the used live set was about 20 MB (the current size of the live set was checked with the Management Console).
(256 20) *1,024 / 7.5 ≈ 32,222 seconds ≈ 537 minutes ≈ 22 hours
If left unchecked, this memory leak would, in about 22 hours, result in an OutOfMemoryError that would take down the JVM and the application it is running.
This gives us plenty of time to find out who is holding on to references to the suspected leaking objects. To find out what is pointing to leaking char arrays, right click on the type in the trend table and click on Add to Type Graph, as shown in the following screenshot:
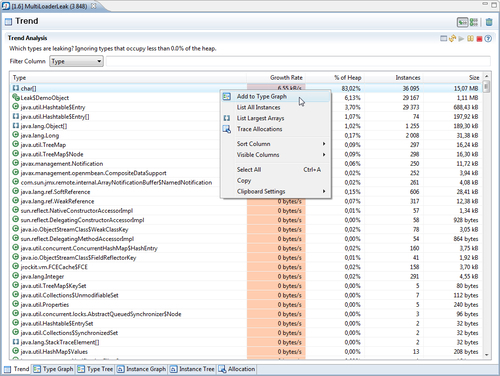
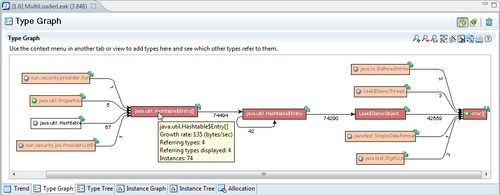
This will add the selected class to the Type Graph tab and automatically switch to that tab. The tab is not a type graph in the sense of an inheritance hierarchy, but rather a graph showing how instances of classes point to other classes. The Type Graph will appear with the selected class, as shown in the following screenshot:
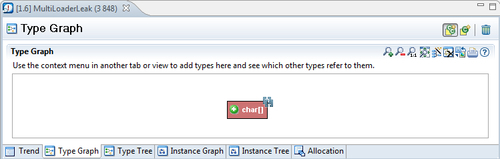
Clicking on the little plus sign (![]() ) to the left of the class name will help us find out what other types are referring to this type. We call this expanding the node. Every click will expand another five classes, starting with the ones that leak the most memory first.
) to the left of the class name will help us find out what other types are referring to this type. We call this expanding the node. Every click will expand another five classes, starting with the ones that leak the most memory first.
In the Type Graph, just like in the trend table, types that are growing over time will be colored red—the redder, the higher the leak rate.
As we, in this example, want to find out what is ultimately holding on to references to the character arrays, we expand the char[] node.
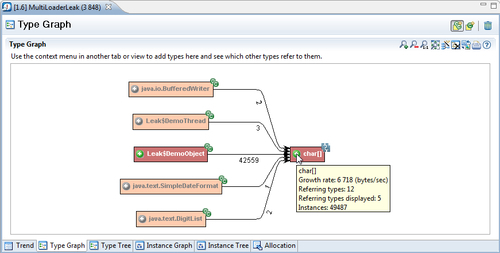
Expanding the char[] node reveals that there is only one other type (or rather instances of that type) that also seem to be leaking and have references to char arrays—the inner class DemoObject of the conspicuously named Leak class.
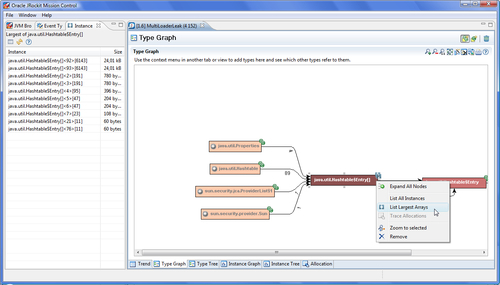
Expanding the Leak$DemoObject node until we don't seem to be finding any more leaking types reveals that the application seems to be abusing some sort of Hashtable, as shown in the next screenshot:
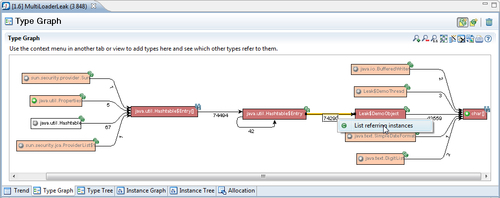
The next step would be to find the particular instance of Hashtable that is being misused. This can be done in different ways. In this example, it would seem that the leaking of the char arrays is due to the leaking of the Leak$DemoObjects. We would therefore like to start by listing the Hashtable$Entry instances that point to Leak$DemoObject.
Note
Classes declared inside other classes in Java, for example the Entry class in Hashtable, have the naming format OuterClass$InnerClass in the bytecode, and this is the way they show up in our profiling tools—in our example, Hashtable$Entry and Leak$DemoObject. This is because when inner (nested) classes were introduced in the Java language, Sun Microsystems didn't want to change the JVM specification as well.
To list instances that are part of a particular relationship, simply right click on the relation and select List Referring Instances, as shown in the following screenshot:
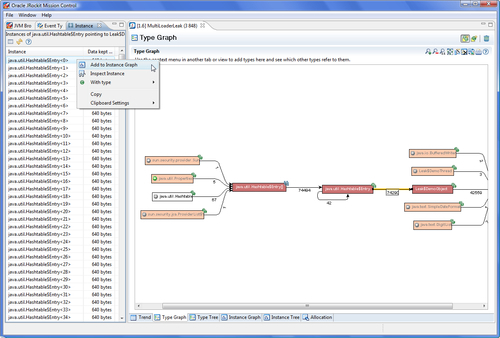
This brings up the instances view, to the left of the Memleak editor, where the instances pointing from Hashtable entries to demo objets are listed. An instance can be added to the instance graph by right clicking on the instance, and selecting Add to Instance Graph from the context menu. This will bring up a graph similar to the Type Graph, but this time showing the reference relationships between instances.
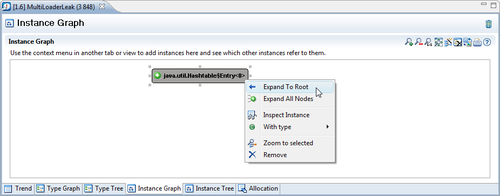
Once the Instance Graph is up, we need to find out what is keeping the instance alive. In other words, who is referring the instance, keeping it from being garbage collected? In previous versions of Memleak, this was sometimes a daunting task, especially when searching in large object hierarchies. As of JRockit Mission Control 4.0.0, there is a menu alternative for letting JRockit automatically look for the path back to the root referrer. Simply right click on the instance and click on Expand to Root, as shown in the next screenshot. This will expand the graph all the way back to the root.
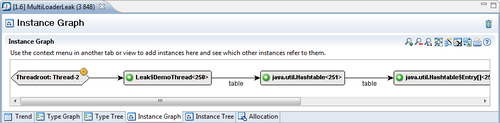
As shown in the following screenshot, expanding to root for our example reveals that there is a thread named Thread-2 that holds on to an instance of the inner class DemoThread of the class Leak. In the DemoThread instance, there is a field named table that refers to a Hashtable containing our leaked DemoObject.
When running in Eclipse, it is possible to view the code that manipulates the table field, by selecting View Type Source from the context menu on the Leak$DemoThread nodes. In this example, we'd find a programming error:
for (int i = 0; i <= 100; i++) {
put(total + i);
}
for (int i = 0; i < 100; i++) {
remove(total + i);
}
As an equals sign is missing from the second loop header, more objects are placed in the Hashtable than are removed from it. If we make sure that we call remove as many times as we call put, the memory leak would go away.
Note
The complete examples for this chapter can be found in the code bundle that comes with this book.
To summarize, the text book recipe for hunting down memory leaks is:
- Find one of the leaking instances.
- Find a path to the root referrer from the leaking instance.
- Eliminate whatever is causing the reference to be kept alive.
- If there still is a leak, start over from 1.
Of course, finding an instance that is unnecessarily kept alive can be quite tricky. One way to home in on unwanted instances is to only look at instances participating in a certain reference relationship. In the previous example, we chose to look at char arrays that were only being pointed to by DemoObjects. Also, the most interesting relationships to look for are usually found where leaking types and non-leaking types meet. In the Type Graph for the example, we can see that once we expand beyond the Hastable$Entry array, object growth rates are quite neutral. Thus, the leak is quite likely due to someone misusing a Hashtable.
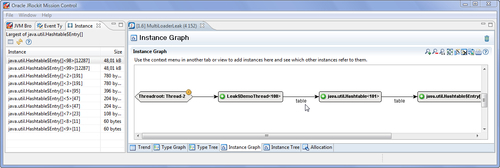
It is common for collection types to be misused, thereby causing memory leaks. Many collections are implemented using arrays. If not dealt with, the memory leak will typically cause these arrays to grow larger and larger. Therefore, another way of quickly homing in on the offending instance is to list the largest arrays in the system. In the example, we can easily find the Hashtable holding on to the DemoObjects by running the leaking application for a while. Use the List Largest Arrays operation on the array of Hashtable entries, as shown in the next screenshot.
If all else fails, statistics will be on your side the longer you wait, as more and more heap space will be occupied by the leaking objects.
Both of the largest Hashtable$Entry arrays are leaking. Adding any one of them to the Instance Graph and expanding it to the root referrer will yield the same result, implicating the instance field table in the Leak$DemoThread class. This is illustrated in the following screenshot:
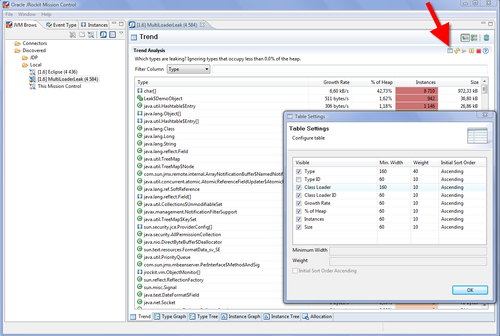
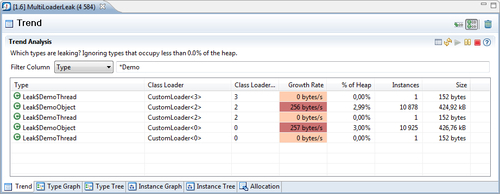
In our next example, there are actually three different classloaders running almost the same code—two with the memory leak and one that actually behaves well. This is to illustrate how things can look in an application server, where different versions of the same application can be running. In Memleak, just like with the other tools in JRockit Mission Control, the tables can be configured to show more information. To see classloader-related information in the table, edit the Table Settings as shown in the following screenshot:
Memleak will, by default, aggregate classes with the same name in the same row. To make Memleak differentiate between classes loaded by different classloaders, click on the Individually show each loaded class (![]() ) button.
) button.
In the next screenshot, the trend table is shown for all classes with names containing the string Demo. As can be seen, there are three classloaders involved, but only two of them are leaking instances of Leak$DemoObject.
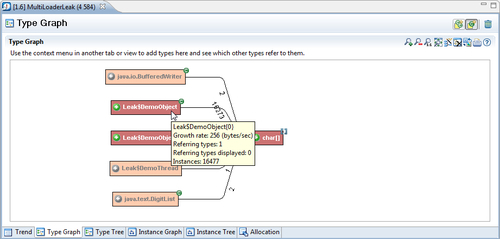
The option of splitting the classes per classloader is also available in the Type Graph. The Type Graph can be configured to use a separate node for each loaded class, when expanding a node. Simply click on the Use a separate node for each loaded class icon (![]() ) in the Type Graph. Following is a screenshot showing the first expansion of the char[] node when using separate nodes for each class. The bracket after the class name contains the classloader ID.
) in the Type Graph. Following is a screenshot showing the first expansion of the char[] node when using separate nodes for each class. The bracket after the class name contains the classloader ID.
It is possible to switch back to aggregating the nodes again by clicking on the Combine classes with same class name button (![]() ). Note that the setting will not change the state of the currently visible nodes. Only nodes that are expanded after changing the setting are affected.
). Note that the setting will not change the state of the currently visible nodes. Only nodes that are expanded after changing the setting are affected.