
This section addresses what a modern runtime can do to speed up memory management, going from impractical and "academic" algorithms to real world performance.
One technique, used in JRockit, that significantly speeds up object allocation is the concept of thread local allocation. It is normally much cheaper to allocate an object locally in a buffer in the running Java thread than going through the synchronized process of placing it directly on the heap. A naive garbage collector doing direct heap allocations would need a global heap lock for each allocation. This would quickly be the site for a nightmarish amount of contention. On the other hand, if each Java thread keeps a thread local object buffer, most object allocations may be implemented simply as the addition of a pointer, one assembly instruction on most hardware platforms. We refer to these thread local buffers as Thread Local Areas (TLA). The TLAs naturally have to processed by the garbage collector as well.
For cache and performance reasons, each TLA is typically between 16 and 128 kilobytes, but this can be modified from the command line. Whenever a thread local buffer is full, everything in it is promoted to the heap. We can think of a thread local buffer as a small thread local nursery.
Whenever a new operator in Java is compiled and the JIT set to a sufficiently high level of optimization, the allocation code turns into a construct that can be illustrated by the following pseudocode:
Object allocateNewObject(Class objectClass) {
Thread current = getCurrentThread();
int objectSize = alignedSize(objectClass);
if (current.nextTLAOffset + objectSize > TLA_SIZE) {
current.promoteTLAToHeap(); //slow and synchronized
current.nextTLAOffset = 0;
}
Object ptr = current.TLAStart + current.nextTLAOffset;
current.nextTLAOffset += objectSize;
return ptr;
}
Note
The pseudocode just seen presents a somewhat simplified view of the world, in order to illustrate the point. Objects that are larger than a certain threshold value or that are too big to fit in any available TLA are still allocated directly on the heap. As of JRockit R28, a measurement used to better optimize TLA usage, called the TLA waste limit, has been introduced. This is discussed to a greater extent in Chapter 5.
In certain architectures where registers are plentiful, further performance gains can be achieved by always keeping the nextTLAOffset, and possibly the pointer to the TLA itself, in registers for the thread that is currently executing Java code. On x86 with its limited register set, however, this is a luxury we can't afford.
As the complexity of a well written GC is mostly a function of the size of the live data set, and not the heap size, it is not too costly to support larger heaps for the same amount of live data. This has the added benefit of it being harder to run into fragmentation issues and of course, implicitly, the possibility to store more live data.
On a 32-bit system, a maximum 4 GB of memory can be addressed. This is the theoretical maximum size of any heap, but of course there are other things that need to be kept in memory as well, such as the operating system. Some operating systems, for example Windows, are very picky about how they lay out kernel and libraries in memory. On Windows, the kernel often lies almost in the middle of the address space, making it difficult to fully utilize all available memory as one contiguous Java heap. Most JVMs only support heaps that consist of contiguous chunks of memory, so this can be a problem.
To our knowledge, JRockit is the only JVM that supports non-contiguous heaps and is able to utilize the memory both above and below the operating system kernel and any other external libraries for its heap space.

In the previous figure, the OS resides roughly in the middle of the address space, effectively limiting the maximum virtual address space for a process. The memory areas A and B come before and after the operating system respectively. A is slightly larger than B, so A corresponds to the largest heap that we can use without support for non-contiguous heaps. A non-contiguous heap implementation would allow us to use the combined memory in A and B for our heap at the price of a small bit of extra bookkeeping overhead. This is implemented by basically pretending that the OS area is a large pinned object in the middle of the address space.
While 32-bit architectures tend to grow less and less common with the 64-bit revolution, there are still scenarios where they are used a lot. Currently, virtualized environments seem to be such a place, and so it still makes sense to maximize performance for 32-bit platforms, with the limited address space that entails.
On a 64-bit system, even when running a 32-bit JVM, the larger available virtual address space can be tweaked so that we don't need to work around occupied areas of the address space.
Most modern architectures are 64-bit, and the theoretical amount of data that fits into a 64-bit address range, 16 exabytes, is staggeringly huge. Currently, it is not affordable to populate that large an address space with physical memory.
There are both benefits and disadvantages to using a 64-bit architecture for automatic memory management, unlike with code generation, which tends to see only benefits (such as more registers, wider registers, and lager data bandwidth).
Pointers on a 64-bit machine are 8 bytes wide instead of 4 bytes. This consumes more bandwidth and CPU cache space. Simplifying a bit, dereferencing a 32-bit pointer is faster than dereferencing a 64-bit one, so a 64-bit 4.1 GB heap, although only slightly larger than a 32-bit 4 GB one, may actually be a lot slower to use.
A fair compromise is the compressed reference optimization that JRockit was the first JVM to implement. If a JVM running on a 64-bit system uses less than 4 GB of heap space, it obviously makes no sense to represent objects as 64-bit pointers. 32 bits are enough, and consequently all object access will be a lot quicker.
Native pointers outside the heap that are still part of the runtime environment must be system wide, 64 bits, on a 64-bit system. The typical example is handles that represent JNI references to Java objects. Transitions to and from native code through JNI may occur in any Java program. For the sake of native code and to some extent the GC, which needs to operate on native pointers internally, we need ways to go from the transform domain of compressed references to that of ordinary system wide pointers. We refer to these transforms as reference compression and reference decompression.
Following is the pseudocode for compression and decompression of a 4 GB heap on a 64-bit platform. The virtual address of the heap base can be placed anywhere in memory.
CompRef compress(Ref ref) {
return (uint32_t)ref; //truncate reference to 32-bits
}
Ref decompress(CompRef ref) {
return globalHeapBase | ref;
}
When compressed references are 32-bit, it suffices to use a logical or with the actual (64-bit) heap base to decompress them into system-wide pointers. This operation has the added benefit that it can be applied an arbitrary number of times without further changing the pointer. However, depending on the number of bits in a compressed reference, this representation isn't always possible and strict state machines must therefore be maintained so we know when a reference is compressed and when it isn't, for example in stubs to and from native code or when the code refers to actual 64-bit handles to objects.
Note that 4-GB heaps aren't the only application of compressed references. For example, consider a 64-GB heap, where instead of using all 64 bits to represent an object, we can use 4 + 32 bits, where four of the bits are used to point out which of sixteen possible 4-GB heap sections an object resides in. Note that this requires four free bits in the object, which in turn requires that allocated objects are aligned on 16-byte boundaries. This may waste some heap space, but can still be a win performance-wise.
CompRef compress(Ref ref) {
return (uint32_t)(ref >> log2(objectAlignment));
}
Ref decompress(CompRef ref) {
return globalHeapBase | (ref << log2(objectAlignment));
}
The method can be made even simpler, if we keep the 16-byte object alignment and make sure that the virtual address space starts at address 0 and ends at address "64 GB". Then a reference may be decompressed by just shifting it four bits left, and compressed by shifting it four bits right, not needing to involve a global heap base. This is how JRockit does it, thereby maintaining 32-bit wide compressed references for the general case. JRockit, for convenience, still wants address 0 to be used for null pointers, so the lowest 4 GB of the virtual space is not used for anything else, effectively reducing the 64 GB of heap to 60 GB, but this is of little importance for performance. If the difference between a 64-GB heap and a 60-GB heap matters to you, you are in trouble anyway.
This method is generic as it works for all heap sizes larger than or equal to 4 GB. The generic approach, however, has a new drawback. The attractive property that decompression can be applied an infinite number of times, to both uncompressed and compressed references, disappears.
Naturally, 64 GB isn't a theoretical limit but just an example. It was mentioned because compressed references on 64-GB heaps have proven beneficial compared to full 64-bit pointers in some benchmarks and applications. What really matters, is how many bits can be spared and the performance benefit of this approach. In some cases, it might just be easier to use full length 64-bit pointers.
Note
JRockit R28 supports compressed references in different configurations that can support theoretical heap sizes up to 64 GB. Parts of the compressed references framework is adaptive.
Some variant of compressed references is always enabled by default in JRockit if the maximum heap size is either unspecified or set to a value less than or equal to 64 GB. The required object alignment (and therefore implementation) varies depending on maximum heap size. Compressed references can be explicitly disabled from the command line.
In JRockit, what we are mostly trying to maximize with the compressed reference approach is the available heap space and the amount of objects that fit in the L1 cache. To avoid a number of problematic special cases, references on a local stack frame in a method are never compressed. Basically, code inserted after every field load decompresses a reference and code inserted before every field store re-compresses it. The overhead from doing this is negligible.
It is also important for the garbage collector to care about other aspects of the underlying system architecture. The most important issue to consider is cache friendliness. Repeated cache misses can cause significant performance degradation.
Note
CPUs contain both instruction and data caches (along with several specialized caches for other purposes). In this section we are addressing data cache issues. A cache consists of several cache-lines of data, which is the smallest accessible cache unit. When data is retrieved from memory, it is placed into the caches so that it can be quickly accessed again in the near future. Accessing data in a cache is orders of magnitude faster than retrieving it from memory.
A CPU cache is usually hierarchical and multi level (for example, with three levels). The first level of cache is the fastest, smallest, and closest to the CPU. On modern architectures, each core tends to have its own L1 cache, while higher level caches may or may not be shared between cores. An L1 cache is usually on the order of kilobytes and an L2 cache on the order of megabytes. Accessing an L2 cache is more expensive than an L1 cache, but still much cheaper than having to go to memory, which will be the case if the highest level cache in the hierarchy misses.
Intelligent prefetching of data into a cache before it is to be accessed can both reduce the number of cache misses if it is the correct data, or destroy cache performance if cache contents are replaced by irrelevant data. An adaptive runtime seems like an ideal environment to find out what data is likely to be relevant.
In code generation, this can be remedied by using runtime feedback to determine which object accesses in Java code cause cache misses and compensate by generating code that does intelligent prefetching. In the memory system, we need to care about things like object placement on the heap, alignment, and allocation strategies.
Using software prefetching to load data that is soon to be accessed, thus getting it into the cache during cycles of other activity, can be very beneficial. This is because when the data is accessed "for real", the cache won't miss.
Note
Explicit prefetching done by the program is known as software prefetching. It should be noted that modern hardware architectures also have advanced hardware prefetching built in that can do an excellent automatic prefetching job if any memory access pattern is regular and predictable enough.
One example of when intelligent prefetching improves garbage collection speed in JRockit stems from the fact that the thread local areas for allocation are divided into many small chunks. When a chunk is first to be used, the next chunk is heuristically prefetched. This means that the following allocations will already have the next chunk of the TLA in the cache.
Done correctly, there are significant performance improvements in using prefetching to improve cache hits.
The downside is of course that every time an item is loaded into the cache, other cached data is destroyed. Prefetching too often may decrease cache functionality. Also, a prefetch retrieves an entire cache line, which takes time, so unless the prefetch operation can be pipelined, or hidden in parallel with other actions before its data is to be used, it has no or even negative effects.
If we know certain data accesses to be sequential or close in time, it makes a lot of sense for the GC to try to place the objects involved on the same cache line—spatial locality follows temporal locality. An example is that a java.lang.String and the char array which it contains are almost always accessed in sequence. The more runtime feedback the memory system has, the better guesses it can make which data should belong together.
There are of course good static guesses as well, that usually pay off, such as trying to best-fit an object on the heap next to other objects that it may reference and an array next to its elements.
Modern Non-Uniform Memory Access (NUMA) architectures provide even more challenges for a garbage collector. Typically, in a NUMA architecture, the address space is divided between processors. This is in order to avoid the bus (and possibly cache) latency bottleneck when several CPUs try to access the same memory. Each CPU owns a part of the address space and memory on a CPU-specific bus. A CPU that wants to access its own memory handles this very quickly, while the further away that the memory is that it wants to access, the longer it takes (depending on the configuration). The traditional approach is Uniform Memory Access (UMA), where all CPUs uniformly access memory and where access time to a particular memory location is independent of which CPU requests it.
Two of the modern NUMA architectures that are used in several server-side environments are the AMD Opteron and the newer Intel Nehalem architecture.
The following figure illustrates a NUMA node configuration:
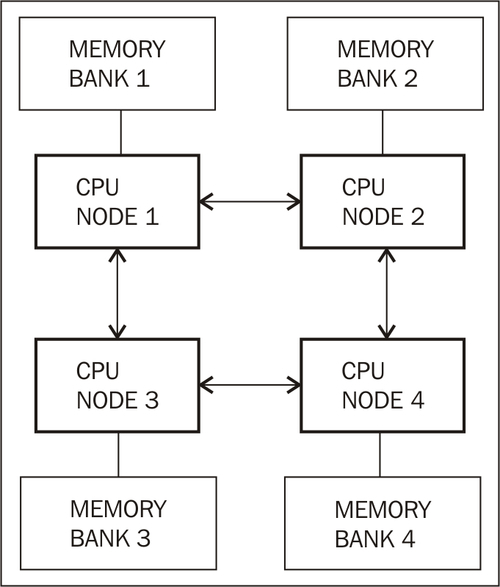
Here, any CPU, or NUMA node, has to perform at most two communication hops with the other NUMA nodes in the system to get at arbitrary memory. The ideal (and the fastest) memory access consists of zero hops (the node's own memory). There is not necessarily be a one-to-one mapping between CPUs and NUMA nodes. For example, one NUMA node may contain several CPUs who share local memory.
So, to perform well on a NUMA architecture, the garbage collector threads should be structured in a beneficial way. If a CPU is executing a mark thread in the GC it should be the one working on the parts of the heap memory that belong to the CPU itself. This way NUMA performance is maximized. As referenced objects may, in worst case, appear anywhere on the heap, on NUMA the GC usually needs an additional object moving heuristic. This is to make sure that objects referenced near other objects in time appear near them in memory as well, evacuating them from suboptimal NUMA nodes. If this works correctly, there are substantial performance gains to be had. The main problem is keeping objects from being moved back and forth, "ping ponging", between memory sections that are the responsibilities of different NUMA nodes. Theoretically, an adaptive runtime could be very good at this.
This is another example of an optimization that can work well in an adaptive runtime, but perhaps not so much in a static environment. Command-line flags that modify memory allocation behavior in the JVM and change NUMA node affinity for the JVM process will be discussed in greater detail in Chapter 5.
At the base of all memory allocations lies the operating system and its page table. An OS divides the physical memory into pages, a page typically being the smallest possible memory allocation unit. Traditionally, a page is somewhere in the order of 4 KB. A process in an OS only sees a virtual address space, not a physical one. In order for a CPU to map a virtual page to the actual physical page in memory, a cache called the Translation Lookaside Buffer (TLB) is used to speed things up. If pages are too small, TLB misses are consequently more common.
This problem can be remedied if pages were several orders of magnitude larger; megabytes instead of kilobytes. All modern operating systems tend to support large pages in some form.
Obviously, in an OS where many processes allocate memory in separate address spaces and where pages are much larger than a couple of KB, fragmentation becomes a bigger problem because more page space is wasted. An allocation that requires slightly more memory than the size of a page suddenly carries a lot of dead weight. This doesn't matter to a runtime that does its own memory management in one process and owns a large part of the memory, but even if it were a problem it could be remedied by providing abstraction for many different page sizes on an underlying large page.
Note
A performance increase of at least 10 percent can usually be gained for a memory intensive application if it runs on large pages instead of normal ones. JRockit has support for this and can use large pages if enabled on the underlying operating system.
Typically, on most operating systems, enabling large page support is a privileged operation that requires administrator access, which makes it slightly harder to just "plug and play".
As we have discussed to a great extent in the chapter on code generation, adaptability is the key to success in a runtime for a mobile language such as Java. Traditionally, only code was adaptively reoptimized and was subject to hotspot analysis. However, the JRockit designers recognized from the start that all aspects of the runtime system should be made adaptive if possible.
So, JRockit may heuristically change garbage collection behavior at runtime, based on feedback from the memory system and adjust parameters such as heap size, number of generations in the heap, and even the overall strategy used to garbage collect.
Here is an example output generated by running JRockit with the -Xverbose:gc flag:
marcusl@nyarlathotep:$ java -Xmx1024M -Xms1024M -Xverbose:gc -cp dist/bmbm.jar com.oracle.jrpg.bmbm.minisjas.server.Server
[memory] Running with 32 bit heap and compressed references.
[memory] GC mode: Garbage collection optimized for throughput, initial strategy: Generational Parallel Mark & Sweep.
[memory] Heap size: 1048576KB, maximal heap size: 1048576KB, nursery size: 524288KB.
[memory] <s>-<end>: GC <before>KB-><after>KB (<heap>KB), <pause>ms.
[memory] <s/start> - start time of collection (seconds since jvm start).
[memory] <end> - end time of collection (seconds since jvm start).
[memory] <before> - memory used by objects before collection (KB).
[memory] <after> - memory used by objects after collection (KB).
[memory] <heap> - size of heap after collection (KB).
[memory] <pause> - total sum of pauses during collection (milliseconds).
[memory] run with -Xverbose:gcpause to see individual pauses.
[memory] [YC#1] 28.298-28.431: YC 831035KB->449198KB
(1048576KB), 132.7 ms
[memory] [OC#1] 32.142-32.182: OC 978105KB->83709KB (1048576KB), 40.9 ms
[memory] [OC#2] Changing GC strategy to Parallel Mark & Sweep
[memory] [OC#2] 39.103-39.177: OC 1044486KB->146959KB (1048576KB), 73.0 ms
[memory] [OC#3] Changing GC strategy to Generational Parallel Mark & Sweep
[memory] [OC#3] 45.433-45.495: OC 1048576KB->146996KB (1048576KB), 61.8 ms
[memory] [YC#2] 50.547-50.671: YC 968200KB->644988KB (1048576KB), 124.4 ms
[memory] [OC#4] 51.504-51.524: OC 785815KB->21012KB (1048576KB), 20.2 ms
[memory] [YC#3] 56.230-56.338: YC 741361KB->413781KB (1048576KB), 108.2 ms
...
[memory] [YC#8] 87.853-87.972: YC 867172KB->505900KB (1048576KB), 119.4 ms
[memory] [OC#9] 90.206-90.234: OC 875693KB->67591KB (1048576KB), 27.4 ms
[memory] [YC#9] 95.532-95.665: YC 954972KB->591713KB (1048576KB), 133.2 ms
[memory] [OC#10] 96.740-96.757: OC 746168KB->29846KB (1048576KB), 17.8 ms
[memory] [YC#10] 101.498-101.617: YC 823790KB->466860KB (1048576KB), 118.8 ms
[memory] [OC#11] 104.832-104.866: OC 1000505KB->94669KB (1048576KB), 34.5 ms
[memory] [OC#12] Changing GC strategy to Parallel Mark & Sweep
[memory] [OC#12] 110.680-110.742: OC 1027768KB->151658KB (1048576KB), 61.9 ms
[memory] [OC#13] Changing GC strategy to Generational Parallel Mark & Sweep
[memory] [OC#13] 116.236-116.296: OC 1048576KB->163430KB (1048576KB), 59.1 ms.
[memory] [YC#11] 121.084-121.205: YC 944063KB->623389KB (1048576KB), 120.1 ms
Note
JRockit versions from R28 tend not to change garbage collection strategies at runtime. Default values will be picked depending on configuration. This, along with better garbage collectors, was found to provide a larger degree of determinism for customers.
The previous output is from the R27 line of JRockit releases. For R28, non-standard GC strategies should be explicitly specified on the command line. R28 defaults to a generational parallel mark and sweep (optimized for throughput). The R28 memory management system still adaptively modifies many aspects of the garbage collection behavior, but to a lesser extent than R27.
All garbage collections in the previous example take place using a parallel mark and sweep algorithm, optimized for throughput. However, the JVM heuristically decides whether nurseries should be used or not depending on feedback from the runtime system. In the beginning, these changes are fairly frequent, but after a warm-up period and maintained steady-state behavior, the idea is that the JVM should settle upon an optimal algorithm. If, after a while, the steady-state behavior changes from one kind to another, the JVM may once again change strategies to a more optimal one.