
This chapter covers threads and synchronization in Java and in the Java Virtual Machine. Threads are the de facto mechanism for running several parallel tasks in a process. Locks are the de facto mechanism for constraining access to a critical section of code to one thread at a time. These are the building blocks we need in order to implement parallelism in software.
You will learn the following from this chapter:
- How fundamental parallel concepts such as threads and synchronization work in Java and how the Java APIs can be used for synchronization. This includes concepts like
wait, notify, and the often misunderstoodvolatilekeyword. We will also briefly look at thejava.util.concurrentpackage. - The concept of the Java Memory Model, and why it is required. Understanding the memory model is the key to writing working multithreaded Java programs.
- How the JVM can efficiently implement threads and synchronization and a discussion about a few different models.
- How the JVM can optimize threads and synchronization using different types of locks, locking policies, and code optimizations, all based on adaptive runtime feedback.
- How to avoid common pitfalls and false optimizations in parallel Java programming—learning to stay clear of things like deprecated
java.lang.Threadmethods and double checked locking. - How to work with JRockit to modify thread and synchronization behavior as well as an introduction on how to do lock profiling.
Java was, from its inception, a language designed for parallelism. It has intrinsic mechanisms like the java.lang.Thread class as an abstraction for threads, a synchronized keyword and wait and notify methods in every object. This made it fairly unique at the time of its release, at least outside academia. The most common approach for commercially proven languages so far was to use platform-dependent OS library calls for thread management. Naturally, Java needed a platform-independent way to do the same, and what can be better than integrating the mechanisms for parallelism and synchronization into the language itself?
Java is a nice language to work with, when it comes to synchronization. Not only does it have explicit constructs that can be used for threads, locks, and semaphores but it was also designed so that every object in a Java program can conveniently be used as the limiting resource, or monitor object, constraining access to code in a critical section. As of Java 1.5, the JDK also contains a package full of useful parallel data structures, java.util.concurrent.
Note
The term monitor is used to represent a handle to a synchronized resource—only one thread can hold the monitor at a time, thus being allowed exclusive access to the resource.
The advantages of this are obvious—Java synchronization involves no third-party library calls and the semantics for locking are well-defined. It is easy to use locks and threads when programming Java.
A disadvantage may be that it is too easy. It is simple to add synchronization anywhere and everywhere "just to be sure", resulting in possible performance loss.
There are, of course, also questions of implementation overhead. As every object is allowed to be a monitor, every object also needs to carry synchronization information (for example whether the object is used in a lock right now, how that lock is implemented, and so on). Typically, to enable quick access, this information is stored in a lock word that exists in the header of every object. For more than the simplest form of automatic memory management, similar performance concerns also exist. Therefore, fundamental GC info, such as what GC state an object is in, must also be available for quick access. Recollect, for example, the discussion about mark bits from the section on tracing garbage collection in Chapter 3. Thus, both locking and GC need certain kinds of information to be quickly available on a per-object basis. Consequently, JRockit also uses a few bits in the lock word to store garbage collection state information. However, we will still refer to this word as the "lock word" for convenience throughout this text.
Naturally, too compact a meta info representation in every object header introduces extra execution overhead for decoding and encoding the information. A too large representation introduces extra memory overhead in every object instead. Thus, some care has to be taken when choosing a representation for the lock and GC bits for the object.
Another thing that needs to go into every object header is a pointer to its type information. JRockit calls this the class block.
The following figure shows the layout of a Java object in JRockit. All words in the header are 32-bit wide on all platforms to save memory and provide faster dereferencing. The class block is a 32-bit pointer to an external structure, with type information for the object and virtual dispatch tables.
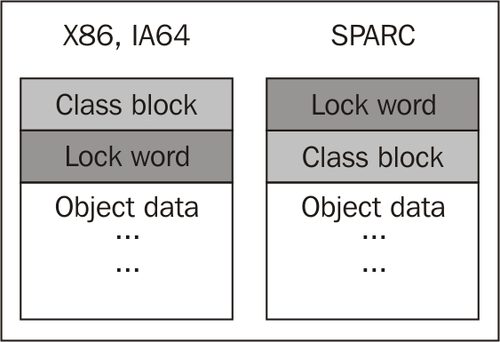
In JRockit, and as far as we know in most JVMs, a complete object header is represented by two 32-bit words. JRockit stores type information at the 0th offset of an object pointer and the lock word four bytes into the object. On SPARC, the layout is reversed because there it is cheaper to execute atomic instructions that manipulate pointers with no offset. As the class block, unlike the lock word, is not subject to any atomic operations, it can be placed later in the header on SPARC.
Note
We define an atomic instruction as a native instruction that can only be either fully executed or not executed at all. When it is fully executed, its results are guaranteed to be visible to all potential accessors.
Atomic operations are required for reads and writes to the lock word, as they have to be exclusive—they are the most fundamental building block of the synchronization state machine in the JVM.
Note
Various academic research has shown that there is relatively little to be gained by compressing an object header further, for example into a single 32-bit word. The extra processing overhead does not make it worthwhile, even though it saves some more memory per object.
True for most platforms and programming languages is that a single concurrency problem may manifest itself in many different ways such as deadlocks, livelocks, or plain crashes. The common denominator is usually non-determinism. This is a classic challenge. As concurrency problems tend to depend on timing, attaching a debugger to the running program before it breaks might not necessarily reproduce the issue. Timing changes with the added debugger overhead.
Note
A deadlock occurs when two threads are sleeping, both waiting for the other to finish using a resource that each of them needs. Obviously, they never wake up. A livelock is similar, but involves active processing from the threads. One can liken it to the case when two people meet in a narrow corridor and step out of each other's way, but happen to do it in the same direction so that they end up blocking each other again.
Because of these kinds of issues, debugging parallel systems is generally difficult. The greatest help comes from visualization aids and debuggers that can untangle thread and lock dependencies.
JRockit, like all major JVMs, supports dumping stack traces from all threads in a running Java application to the console, along with lock holder information. This is enough to resolve simple deadlock problems, where it is possible to determine which mutually dependent threads are stuck waiting for a single resource. Examples will be given later in this chapter.
The JRockit Mission Control suite can also be used to visualize lock information in a more convenient way.
It is also very common that performance issues arise from using synchronization. Every lock is a bottleneck, as it introduces a critical section that can only be accessed by one thread at a time. The more threads trying to get at a critical section, the more contention will arise as threads have to wait their turn. If a lock is badly placed or covers too wide a section in the interest of easier debugging (or just because of general laziness) performance penalties will almost certainly occur.
Sadly enough, it seems to be quite a common case in commercial software that a single lock or a just a few locks cause the majority of the latency in a program. We have seen this more than once when debugging third-party applications. The programmer is normally not aware of this. Luckily, if the problematic locks are few and can be identified, the latency problem is simple to fix. Again, the JRockit Mission Control suite can be used to easily establish which locks are most contended in a running program.
The JRockit Mission Control suite comes with a unique component for latency analysis that, given a JRockit flight recording of a Java program, visualizes latency data for the program. Latency analysis can be the programmer's best friend when optimizing concurrent programs with plenty of synchronization. Instead of taking the traditional profiler's approach of displaying where the program spends its active runtime, the latency analyzer provides information on where it does not. Any nanosecond where a thread isn't executing Java code is mapped and laid out in a thread graph. This way, it can be determined if the idle time is spent waiting for I/O or the network, or, which is potentially more serious, in Java locks, i.e. code waiting to enter synchronized blocks or methods.
Note
Latency analysis with JRockit Mission Control is covered in greater detail in the next section of this book, where the JRockit Mission Control suite is introduced, specifically in Chapter 8, The Runtime Analyzer and Chapter 9,The Flight Recorder.
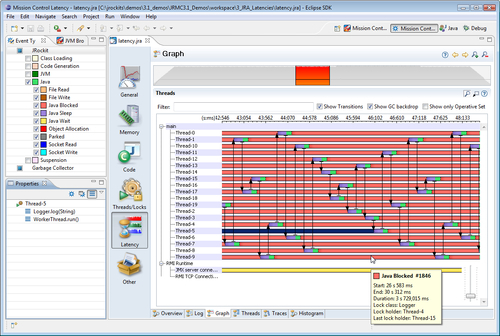
The following screenshot shows the latency analysis tab in the JRockit Runtime Analyzer. The data comes from a recording of a running server application and the recording is now about to be examined offline. One colored bar per thread in the program represents where the program spent its time during the recording. The time axis goes from left to right. A different color is used for each latency generating activity. In the following screenshot, all thread bars are mostly the same color. In this case red, meaning "blocked in Java". This is bad, as it means almost all program time was spent waiting for a Java lock, for example in a synchronized block. To be precise, all colors except green mean "not executing Java". This might entail native threads waiting for I/O or network traffic or any other source of latency.
Recollect our intuitive latency argument on memory management from Chapter 3—if the JVM spends clock cycles garbage collecting, these cannot be used to execute Java code. Similarly, if the clock cycles are spent waiting for file I/O or Java locks, latency arises. This is the same kind of latency—time spent outside Java execution. It affects response times and is the root of most performance problems.