Due to the change to an event-based data model, some things are radically different compared to JRA. For instance, almost every tab now has a range selector. As everything now is an event, it almost always makes sense to be able to filter out data for a specific period of time. Another major change is that the data in general is much more fine-grained and there is a large number of new data sources.
We will discuss some of the more fundamental differences in detail.
The following screenshot shows the General | Overview tab in the Flight Recorder GUI. This can be compared with the way it looked in JRA, as introduced in Chapter 8, The Runtime Analyzer.
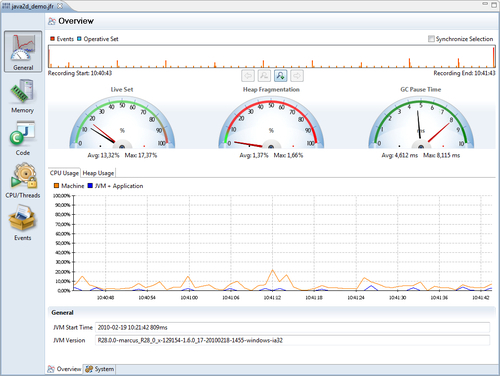
As mentioned, the range selector (available at the top of the window) can now be found in almost every tab in the Flight Recorder. The backdrop for the range selector in a tab normally shows the amount of events active during the time of recording for the events used in that particular tab. For example, the Overview tab uses various heap, garbage collection, CPU usage, and general information events.
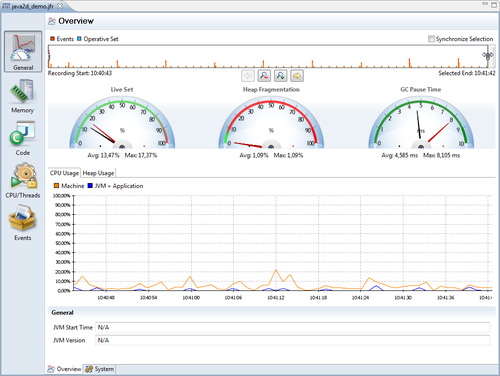
One effect of the event-based data model is that it is possible to select a range that does not include an event where such data is available. Recall from Chapter 8 that some of the general information is written at the end of the recording. In the Flight Recorder, some events are written at the end of a chunk. If a range is selected that does not include the needed event, N/A is displayed, as shown in the following screenshot. Thus, care should be taken when modifying the range so that events of interest are actually included for the active view.
As the range selector is used in so many places, it is now possible to synchronize the selected range between all range selectors in all tabs. Check the Synchronize Selection check box to make the other range selectors follow the selection made.
Just as before, in JRA, the Operative Set will be highlighted in turquoise if any of the events are added to the Operative Set.
The Operative Set has also been improved. It is now possible to manipulate the Operative Set from most views, even the ones mimicking the old JRA-style tabs.
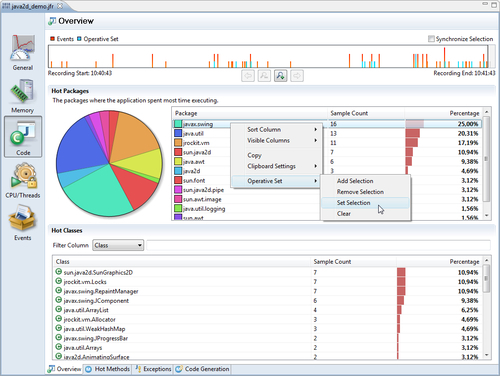
In the screenshot, we are adding the code samples found in the javax.swing package that, in this case, is the hottest package to the operative set. The corresponding events are highlighted in the range selector.
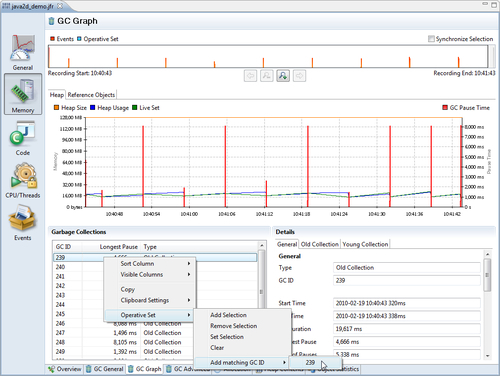
Event attributes can now have a relational key. The relational key is globally unique, and is used to associate events of different types with each other. One such example is the GCID of the GC events. The GCID is specified to have the relational key http://www.oracle.com/jrockit/jvm/vm/gc/id. This makes it easy to find all events that are related to a specific garbage collection.
The user interface provides menu alternatives on the Operative Set context menu for events having attributes with relational keys. In the next screenshot, we do this for garbage collection number 239:
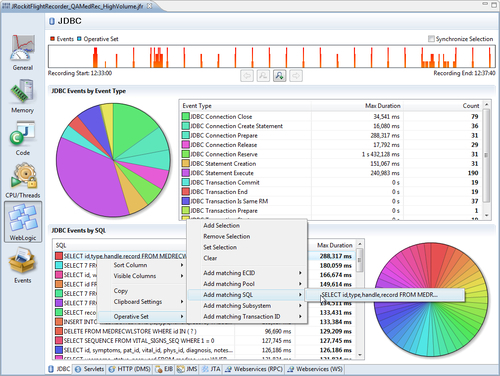
Third-party event producers use the relational key to associate events across producers. For instance, WLDF and DMS use the Execution Context ID (ECID) relational key to associate events across probes and producers all over WebLogic Server. It is, for example, possible to add all the events associated with a certain database call to the Operative Set.
These producers also provide relational keys for other attributes. The following example screenshot uses the experimental WebLogic Tab Pack to illustrate this by adding all the events with a matching SQL statement to the operative set.
Note
The experimental plug-ins used in some of the examples in this book, such as the WebLogic Tab Pack, are only available for JRockit Mission Control 4.0.1 or later. Chances are that this book is published before the release of 4.0.1, and that the plug-ins will not be available for a little while. The good news is that the experimental plug-ins are available for download from within the JRockit Mission Control 4.0.1 GUI. As soon as version 4.0.1 (or later) of Mission Control is out, the authors' advice is to upgrade immediately.
Now that everything is an event, it is no longer wise to assume that all events are latency-related, as was the case in JRA. By latency-related, we mean any event directly involved in stalling the execution of a thread. There are specific tabs in the Flight Recorder GUI that deal with latency-related events, and latency-related Java events may still be used in a fashion similar to the old latency analyzer in JRA.
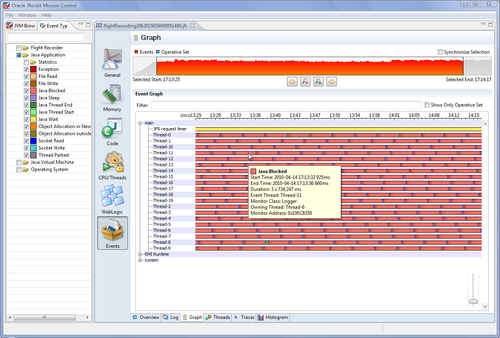
The Events tab group now contains general-purpose tabs for visualizing events, similar to how the Latency tab group was used in JRA. The following screenshot shows a synchronization problem:
If only the Java Application events are selected in the Event Types view, the result will be very similar to the way things looked in the old latency analyzer in JRA.
The specialized tabs related to latencies can be found under the CPU | Threads tab group. There are new tabs in the Flight Recorder that aggregate the latency-related events in several interesting ways. The Latencies tab will, for instance, show an aggregation per event type, and the aggregated stack traces for the selected event type. In the next example, which is a recording from the Java 2D demo shipped with the JDK, we can see that the threads are mostly halted by (explicit/voluntary) sleeps.
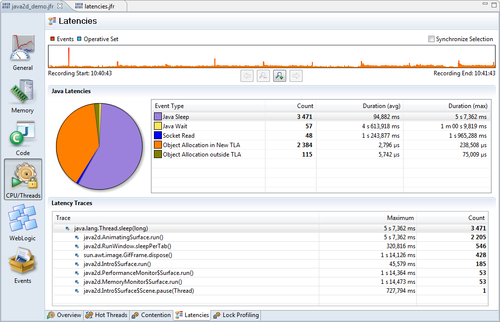
This is as would be expected, as there is probably a lot of thread sleeps going on between each rendering pass in the rendering loops. Note that the pie chart to the left is based on the event count, and not on the max duration, on which the table is sorted.
Note
In Mission Control 4.0.0, the pie chart is bound to a pre-defined column. It is possible to change which column by using the design mode, as is explained later in this chapter. In the next minor version of the Flight Recorder, we're exploring the option to bind the pie chart to whichever numerical column was sorted last.
The Contention tab, introduced in JRockit Flight Recorder, is specialized for showing the Java Blocking (threads blocked, waiting on acquiring monitors) events. In the example recording from WebLogic Server shown in the next screenshot, we can see that the longest total time a thread had to wait for acquiring a monitor was spent waiting on an instance of weblogic.servlet.internal.HttpServer, trying to execute the method loadWebApp(...).
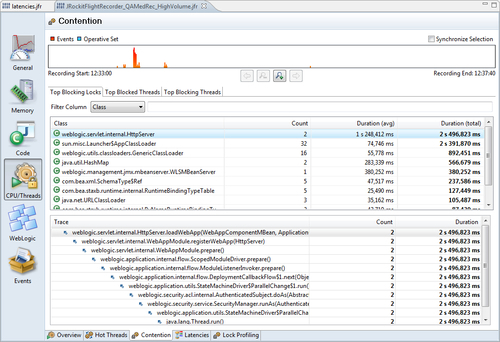
It is also possible to see which threads were blocked the most, as well as which threads were blocking other threads the most.
Just like in JRA, it is possible to enable very detailed lock profiling, and just like in JRA, lock profiling comes with a small additional runtime overhead, even when not recording. To enable lock profiling, start JRockit with the flag -XX:+UseLockProfiling and use the Profiling with Locks template. More information on the lock profiling flags was given in Chapter 4, Threads and Synchronization.
In JRA, the only available exception profiling information was the total number of exceptions being thrown. The only way to correlate that to where in the code the exceptions were thrown, was to change the log settings for the JVM to enable the logging of exceptions. For example, through JRCMD or by restarting the JVM with -Xverbose:exceptions=debug, and then checking the output. With the Flight Recorder, there are now events containing the necessary information, and a tab that allows for easy browsing. Remember to use the Profiling with Exceptions template when creating a recording that is to use exception profiling. The tab is located under Code | Exceptions.
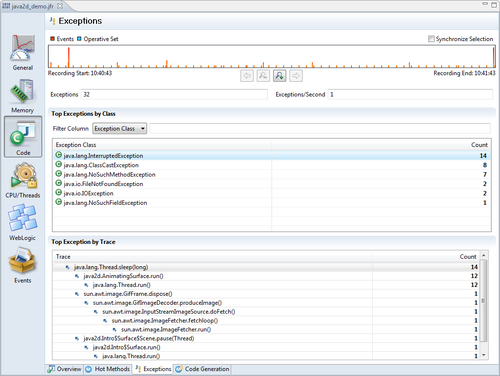
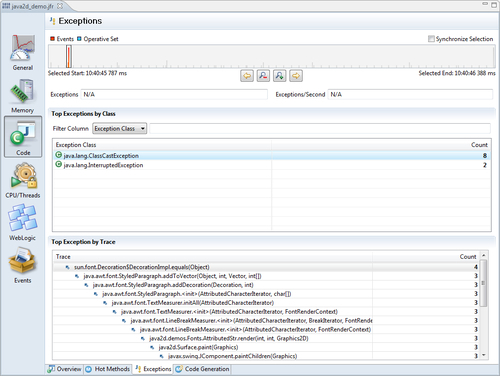
In the example recording from the Java 2D demo, we can see that most of the exceptions are InterruptedExceptions thrown from java2d.AnimatingSurface.run(). The range selector shows us two main bursts of exceptions, one at the beginning of the recording and one at the end. The burst of exceptions at the beginning of the recording is mostly due to ClassCastExceptions, and the burst at the end is due to NoSuchMethodExceptions. This can easily be determined by using the range selector to home in on the peaks, as shown in the following screenshot:
The Java 2D demo does not throw that many exceptions, so the exception data in the recording merely serves as an example on how to use the user interface. If an application throws more than several hundred exceptions per second, the cause should be investigated.
Even though the memory tabs, and the information in them, are quite similar to the old JRA layout there are a few things worth pointing out.
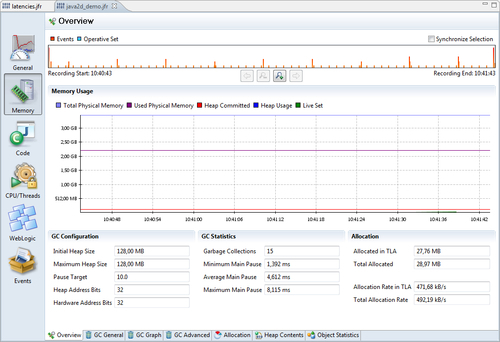
In the Memory | Overview tab, the Total Physical Memory and Used Physical Memory both refer to the physical memory on the machine and not the Java process! In the Java2D Demo recording earlier, the recording was done on a machine with 4 GB of physical memory, and at the point of recording, approximately 2.2 GB was in use. The committed Java heap was as small as 128 MB, as can be seen from both the graph and the GC Configuration section part. To see graphs of the Java heap usage, use the Heap Contents tab.
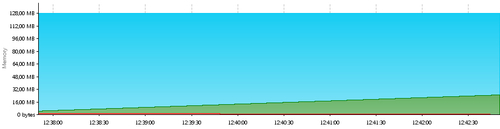
In the Heap Contents tab are two graphs, one focusing on the contents of the heap, and one focusing on how the free space of the heap is distributed. Worth noting in the Heap Contents tab, is that what was previously referred to as dark matter is now called Fragmentation, which is a more descriptive name.
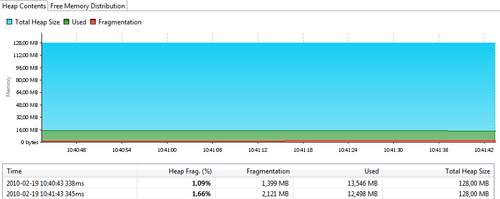
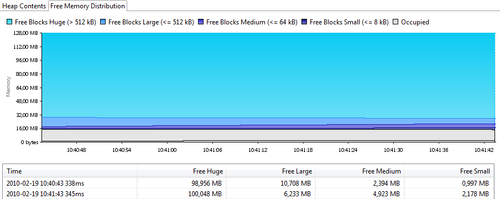
The used memory is simply rendered grey in the Free Memory Distribution chart, with a line delimiting the used and fragmented parts. The charts in the example show a very healthy heap, with lots of free memory and with fragmentation under control. In the following screenshot, most of the free contiguous heap blocks are huge. If the heap were instead made up of a lot of smaller free blocks, an allocation of, for example, a large array would fail and cause the garbage collector to need to perform costly compactions and possibly stop the world.
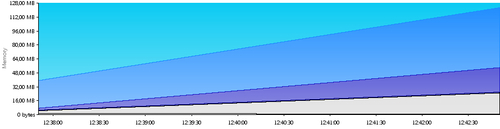
In the next screenshot, a recording from the memory leaking demo application further studied in Chapter 10 is shown. As can be seen, the live set is steadily increasing over time and the free parts of the heap are split into smaller free blocks: