4.9 EXCITATION
The field voltage and current may be specified by a dc generator driven by a motor or by the shaft a of turbine generator. These units are called exciters and the complete voltage controls system, including error detection and various feedback loops is called an excitation system or an automatic voltage regulator (AVR).
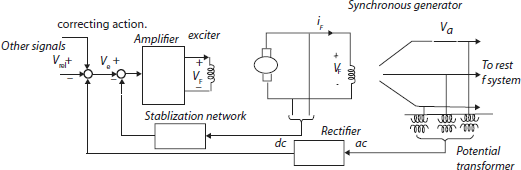
4.9.1 Exciter system block diagram
The following figure represents a simplified excitation system. The control input is Vref. Then Vref is raised while generator terminal voltage |Va| initially remains the same. Ve goes up, VF increases and |Ve| tends to increase.
A new equilibrium reached with a higher |Va|. If |Va| changes because of a change in load, we also get a correcting action (See Fig. 4.12)
4.9.2 IEEE Type-1 excitation model:-
For more quantitative results the standard model is IEEE type-1 model whose block diagram is as shown below.
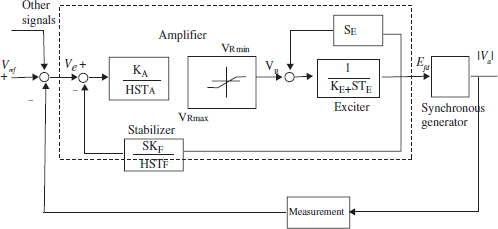
Fig 4.12 Block diagram representation of IEEE Type-1 excitation system and generator
All the variables we are considering are in p.u. In this case, gain of measurement block is unity in the steady state. The amplifier gain is typically in the range of 25 to 400. Ta is typically in the range of 0.02 to 0.4 sec. and VRmin ≤ VRmax. Within the limits, the gain in the linear zone is 1. Typical range of feedback again KF is 0.07 to 0.1 and feedback time constant TF is in the range of 0.35 sec to 2.2 sec.
The open-circuited voltage of a DC generator is proportional to the product of speed times the air gap flux per pole. The flux is a non linear function of the dc generator field current because of saturation effects in the magnetic circuit. When the loading of the generator by ac generator field winding is considered, we get a load saturation curve. The air-gap line is tangent to the lower (approx) linear portion of the open circuit saturation curve. f (VF) measures the departure of load-saturation curve and where k is the slope of the air gap line from the field circuit of the dc generator
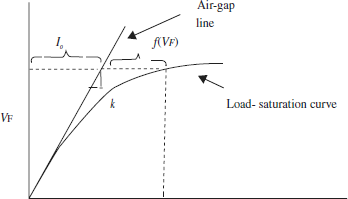
Fig 4.13 Exciter load saturation curve
Where uR = output of the amplifier and R, I λ are resistance, current and flux linkage of the DC generator field winding connected across the amplifier terminals.
Next, assume that dc generator output voltage uF is proportional to the dc generator air-gap flux, which in turn is proportional to λ and
Therefore, substituting Eq(4.22) and (4.24) in (4.23), we get
Multiplying by ![]() we get
we get
The factor s(UF) accounts the load saturation curve from the air-gap line.
Example 4.1
A 200 MVA synchronous generator operates at 50 Hz under nominal loading conditions. If an additional load of 50 MW is suddenly applied, assuming a time lag of 0.65 sec in the speed governor system which delays the opening of steam valve to meet the additional demand, determine the frequency of the system before the system flow commences. Given that H = 7 MW-sec/MVA of generator capacity.
Solution:
From the given data
where H is the inertia constant in MW-sec/MVA
Pr is the generation rating in MVA
= 7 × 200 = 1400 MW- sec (or)MJ
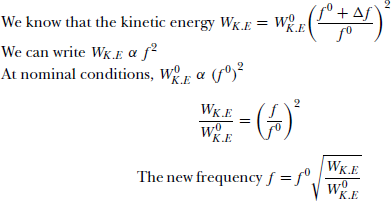
The new kinetic energy
WK.E = W 0K.E − [Energy lost due to the additional load]
= 1400 − [50MW × 0.65 sec]
= 1367.5 MJ
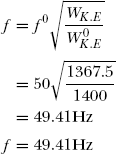
The new frequency of the system before steam flow commence is
Example 4.2
An inductive load Z = R +jX is connected across a supply voltage V. How would a 2 percent drop is frequency affect the real load, if the load is assumed to have a power factor of 0.8 [A.U; Dec 2004]
Solution:
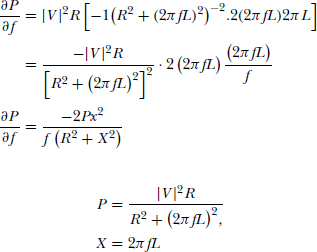
We know that P + jQ = VI* (or) P − jQ = V*I
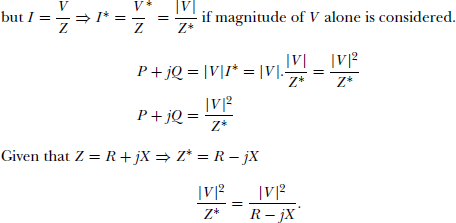
Multiplying with complex conjugate
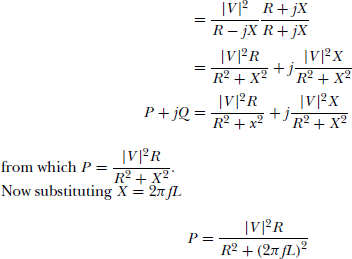
Differentiate w.r.t ‘f’
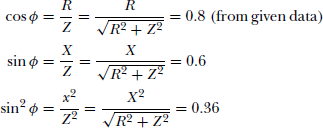
Substituting the above expression in the ![]() equation
equation
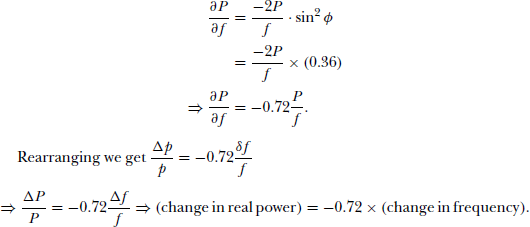
Now a 2% drop is frequency is
change in ‘P’ = −0.72(0.02)
= −0.0144 = −1.44%
= 1.44%increase in load(Due to − ve sign).
Therefore, a 2% drop in frequency increases the load by 1.44
Example 4.3
An inductive load of Z = R +jX is connected across a supply ‘V’. By how many percent will the real drop be if the voltage is reduced by 5?.
Solution:
From Example 4.2,
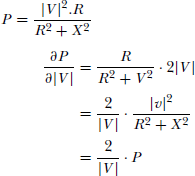
Change in real power = 2× (change in voltage)
Now, for a 5% drop in voltage,
change in ‘P’ = 2 × 0.05 = 0.1 = 10%
Therefore a 5% drop in voltage reduces the load by 10%
Example 4.4
Considering Example 4.1, if a load of 50 MW is suddenly removed instead of adding for the same system parameters, determine the frequency of the system before the steam flow begins to decrease.
Solution:
From Example 4.1 we know that,
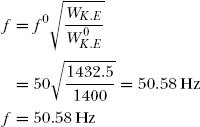
but f 0 = 50Hz
W 0K.E = H × Pr = 7 × 200 = 1400 MW sec
The new kinetic energy
WK.E = W0K.E + [Energy gained due to decrease in load]
= 1400 + [50 MW × 0.65 sec]
= 1432.5 MW sec
The new frequency of the system before steam flow start to decrease: is