5.7 MATRIX REPRESENTATION OF ALL STATE EQUATIONS
It is in the form of
ẋ = Ax + BU + Fd
U – control vector
d – disturbance vector
x – state vector
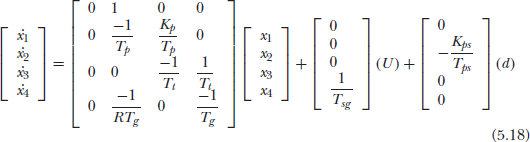
Equation (5.18) is converted into standard state space model form.
i.e. ẋ = Ax + Bu is written as follows:
If x is made up of the sum of transient and steady state value, and U is also made up of transient and steady state value, then
![]() . then substitute in the equation ẋ = Ax + BU + Fd
. then substitute in the equation ẋ = Ax + BU + Fd
Therefore, ẋ = Ax1 + Axss + BU1 + BUss + Fd (5.19)
If a sudden disturbance occurs and the system reaches the steady state value, then ẋ = 0
Therefore Axss + BUss + BU1 + Fd = 0
and the transient term is also zero under steady state. Hence ẋ = 0 ⇒ Axss + BUss + Fd = 0
Example 5.1
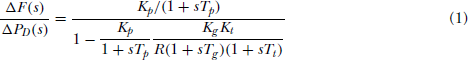
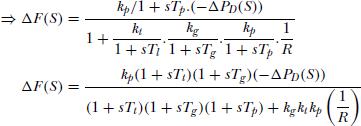
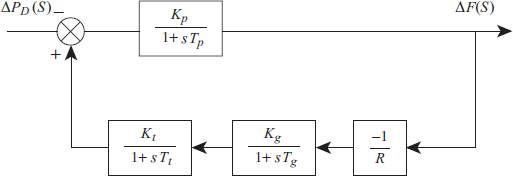
Consider the block diagram model of LFC (load frequency control) given in Figure 5.11.
Make the following approximation
(1 + sTg )(1 + sTt ) = 1 + (Tg + Tt )s = 1 + sTeq.
Solve for ∆ƒ(t) with parameter ∆PD=0.01.
Solution:
Consider input ∆PC (S) = 0, then there is only one input i.e., ∆PD (S).
Redrawing the above block diagram as in Fig 5.12,
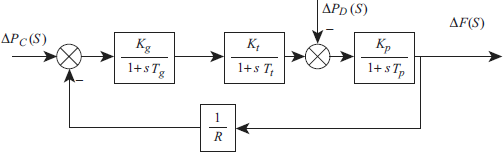
Fig 5.11 Single are LFC
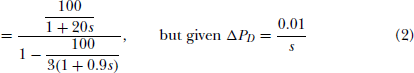
By equating the same order coefficients of s
Solving Equations (1) and (2).
Therefore Δf(t) = −0.01537e−0.05t + 0.00635e35.92t
Example 5.2
Determine the automatic load frequency control (ALFC loop parameters for a control area having the following data:
Total rated area capacity = 2000 MW
Normal operating load = 1000 MW
Inertia constant H = 5
Regulation R = 2.4 H/MW
Solution:
For an isolated single area, consider the following data:
Area capacity = 1000 MW
Normal operating load = 500 MW
Inertia constant = 5 sec
Speed Regulation R = 5 % = 2.5 Hz/p.u MW
Operating frequency f0 = 50 Hz
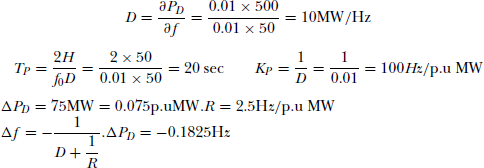
The load decreases by 1 percent. For a decrease in frequency by 1 percent, find the gain and time constant of the power system represented by a first order transfer function. If it is an uncontrolled area then find out the change in frequency due to an increase of load by 75 MW. Find in what proportion (the increase in load demand is met by the increase in generation, and the decrease in load due to drop in frequency?
Solution:
Increase in generation APG,
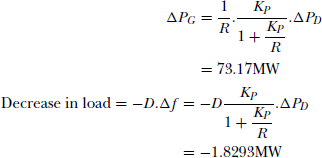
Example 5.4
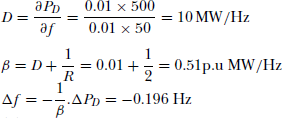
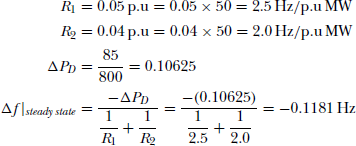
A control area had a total rated of capacity 1000 MW. The speed regulation ‘R’ for all the units in the area is 2 Hz/p.u MW. A one percent change in frequency causes a one percent change in load. If the system is operating at half of the rated capacity and the load increase by 2 percent,
- find the static frequency drop.
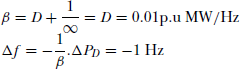
- if the speed governor loops were open what would be the frequency drop.
Solution:
Example 5.5
An uncontrolled isolated power system has the following parameters:
Rated output=350 MW
Regulation=0.06 p.u
Inertia constant=5
Turbine time constant=0.6 sec
Governor time constant=0.3 sec
Nominal frequency=50 Hz
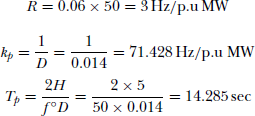
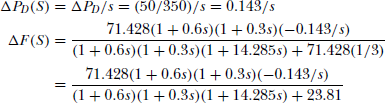
The load varies by 0.7 percent for a 1 percent change in frequency. Determine the steady state frequency deviation in Hz for a load change of 50MW.
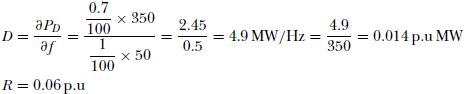
(Note: R unit is Hz/p.u MW only, therefore the numerator p.u in the given data is converted to Hz by multiplying with its base.)
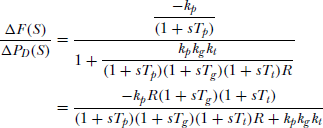
We know that for the uncontrolled case,
kg kt = 1, and substituting for kp, Tt, Tg, ΔPD(S), R in above equation.
but
![]()
Now actual frequency of the system
f = f° + Δf|steady state = 50 + (−0.429)
f = 49.571 Hz
Example 5.6
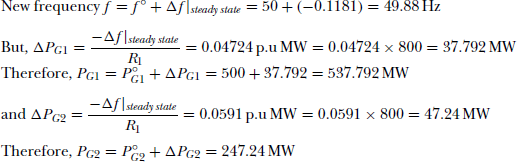
An uncontrolled single area has two alternators with speed governors. Generating unit ’1’ is rated 600MVA, with 5 percent speed regulation is p.u. and generating unit ‘2’ is rated at 400MVA, with 4 percent speed regulation in p.u. Under nominal operating conditions with ƒ° = 50 Hz, both the units share a load of 700MW. With an assumption that no frequency dependent load is connected to the system, find the new frequency and load share between each generators for an additional load of 85MW, if the initial share is 500MW and 200MW on alternators ‘1’ and ‘2’ respectively. Assume a base of 800MW.
Solution:
Example 5.7
Repeat Example 5.6 assuming frequency dependent load such that load increases by 1 percent for 1 percent increase in frequency.
Solution:
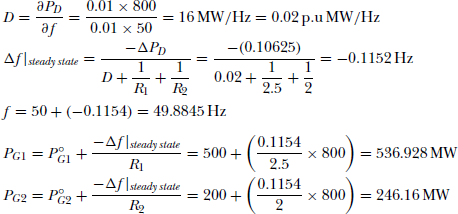
Note: In this case, because of load frequency dependency the actual load is 783MW, when compared to the previous case (Example 5.6) where the load is 785MW.
Example 5.8
Obtain the dynamic response of an uncontrolled isolated power system with the following loop parameters R = 2 Hz/p.u MW, kp = 75 Hz/p.u MW, Tp = 20 sec, ∆PD = 0.02 p.u.
Solution:
We know that the dynamic response of an uncontrolled isolated power system is given by
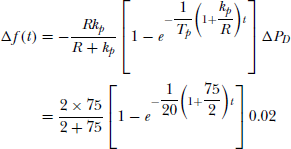
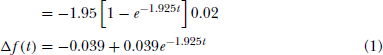
Based on Equation (1) the response can be obtained as shown below:
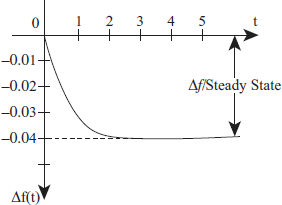
Fig 5.14 Dynamic response of single area LFC
Example 5.9
A single area load frequency control system has the following parameters with free governor action:
Total capacity Pa = 1800 MW
Nominal operating load PD = 900 MW
Nominal frequency f° = 50 Hz
Inertia constant H = 5 sec
Regulation R = 4 percent
kp = 90 Hz/p.u MW
Given that Tp = 20 sec, Tg = Tt = 0.4 sec, 1 percent change in frequency causes 1 percent change is load.
- Check whether the ALFC is stable or not.
- Determine the location of three eigen values.
- From Fig 5.5
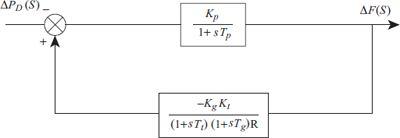
Fig 5.15 Single area LFC with ∆PC (s) = 0
Therefore the characteristic equation is
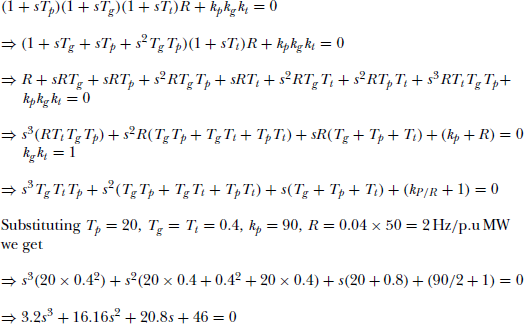
Since all the elements in the first column are > 0, the system is stable.
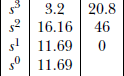
- Finding the root of the equation 3.2s3 + 16.16s2 + 20.8s + 46 = 0
x1 = −4.31, x2 = −0.3672 ± j1.788
The Eigen values are
−4.31, −0.3672 + j1.788, −0.3672 − j1.788.
Example 5.10
A generator has a primary ALFC loop characterizer by R = 4 percent. The secondary loop is open. It is feeding a load consisting of three equal resistors ‘R’ connected in a star network. The frequency is 50 Hz. The resistances are decreased until the frequency drops to 49 Hz. Find by how many percent the resistance ‘R’ has to be decreased. Assume that the AVR loop keeps the terminal voltage constant.
Solution:
Per phase equivalent of the above data is shown below:
Resistance ‘R’ is decreased until the frequency drops to 49 Hz.
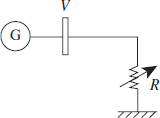
Fig 5.16 Single generator connected to a ‘R’ load
But we know that the power delivered to R is given by P = V2/R Watts and the change in frequency is ∆f = 1Hz.
With R = 4 percent, → 0.04 × 50 = 2 Hz/p.u MW
It shows that 2 Hz causes a 100 percent change in load
Therefore Δf(1 Hz) cause = ![]() = 50 percent change in load.
= 50 percent change in load.
Let the new load be Rx = xR where ‘R’ is the given load.
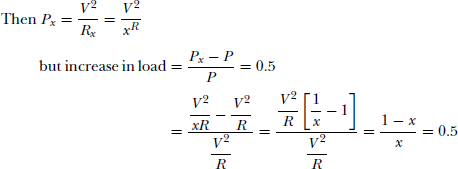
x(0.5) = 1 − x ⇒ x = 0.667
Decrease in R is (100 – 66.67) = 33.33 percent
Resistance R has to be decreased by 33.33 percent for a frequency decrease of 1 Hz