This recipe presents the steps for rendering a credit score graphically using a Google Chart contained within a custom Salesforce CRM formula field. Here we are using a dial-type chart from Google called a Google-o-meter chart. The Google-o-meter is a gauge that points toward a single value on a range. More details can be found at https://developers.google.com/chart/image/docs/gallery/googleometer_chart#introduction.
First, we create a custom account credit score which will feed the values rendered in the graphical range.
To create a custom Credit Score field on the account, follow these steps:
- Navigate to the Account Fields setup page by going to Your Name | Customize | Accounts | Fields.
- Click on New.
- Choose Number from the Data Type options.
- Click on Next.
- Enter
Credit Scorein Field Label. - Enter
3in the Length field.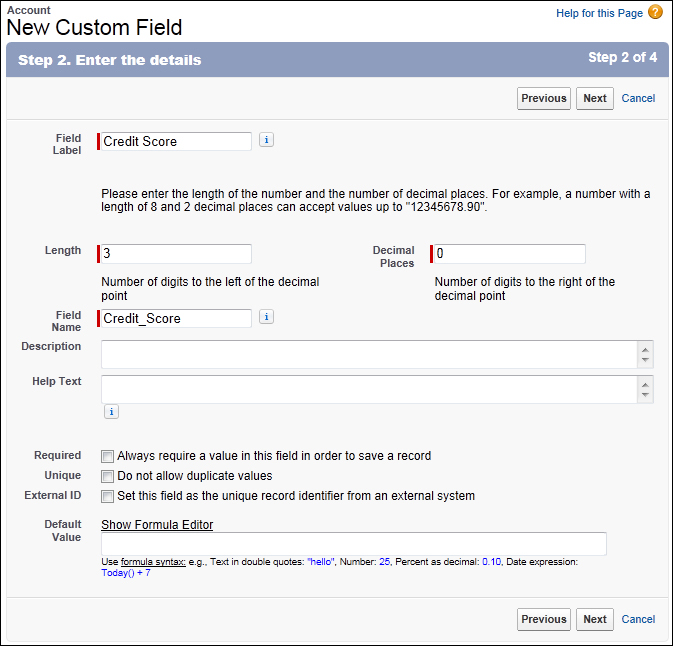
- Click on Next.
- Select the profiles to which you want to grant edit access to this field via field-level security. The field will be hidden from all profiles if you do not add it to field-level security.
- Click on Next.
- Select the page layouts that should include this field. The field will be added as the last field in the first 2-column section of these page layouts. The field will not appear on any pages if you do not select a layout.
- Finally click on Save.
Carry out the following steps to create a formula field to display a Google chart:
- Navigate to the Account Fields setup page by going to Your Name | Customize | Accounts | Fields.
- Click on New.
- Select the Formula option.
- Click on Next.
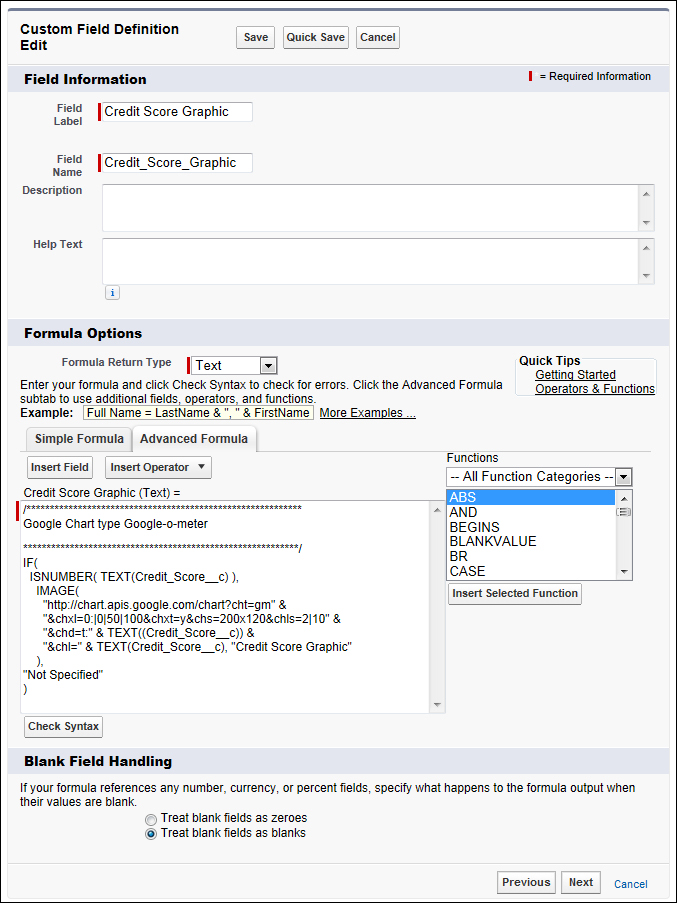
- Enter
Credit Score Graphicin the Field Label textbox. - Click on Field Name. When clicking out of the Field Label textbox Field Name is automatically filled with the value
Graphic_Score_Graphic. - Set the Formula Return Type as Text (as shown in the following screenshot)
- Click on Next.
- Paste the following code in the formula edit box (as shown in the screenshot further below):
/*********************************************************** Google Chart type Google-O-meter ***********************************************************/ IF( ISNUMBER( TEXT(Credit_Score__c) ), IMAGE( "http://chart.apis.google.com/chart?cht=gm" & "&chxl=0:|0|50|100&chxt=y&chs=200x120&chls=2|10" & "&chd=t:" & TEXT((Credit_Score__c)) & "&chl=" & TEXT(Credit_Score__c), "Credit Score Graphic" ), "Not Specified" ) - In the Blank Field Handling section, select the option Treat blank fields as blanks as shown in the following screenshot:
- Click on Next.
- Select the profiles to which you want to grant edit access to this field via field-level security. The field will be hidden from all profiles if you do not add it to field-level security.
- Click on Next.
- Select the page layouts that should include this field. The field will be added as the last field in the first 2-column section of these page layouts. The field will not appear on any pages if you do not select a layout.
- Finally, click on Save.
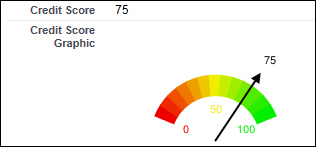
Navigate to an Account Detail page and enter the value 75 in the custom Credit Score number field. Upon saving this, the Account Detail page displays the Credit Score Graphic image as shown in the following screenshot:
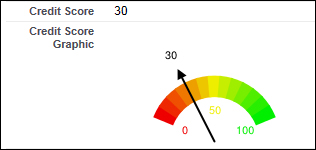
Navigate to the Account Detail page (as above) and enter the value 30 in the Credit Score number field. Upon saving this, the Account Detail page displays the
Credit Score Graphic image as shown in the following screenshot:
Describing each part of the Google Chart code in the formula field gives:
/***********************************************************
Google Chart type Google-O-meter

***********************************************************/
IF(
  ISNUMBER( TEXT(Credit_Score__c) ),
    IMAGE(
      "http://chart.apis.google.com/chart?cht=gm" &
      "&chxl=0:|0|50|100&chxt=y&chs=200x120&chls=2|10" &
      "&chd=t:" & TEXT((Credit_Score__c)) &
      "&chl=" & TEXT(Credit_Score__c), "Credit Score Graphic"
    ),
"Not Specified"
)
The following comment section describes the code in the formula:
/***********************************************************
Google Chart type Google-O-meter

***********************************************************/
The following code snippet checks that the Credit Score contains a number. If so then it continues to build the Google Chart code. If there is no valid number then it returns the value "Not Specified".
IF(
  ISNUMBER( TEXT(Credit_Score__c) ),
<.........................................>
"Not Specified"
)
The following code snippet is for Google Chart image construction:
    IMAGE(
      "http://chart.apis.google.com/chart?cht=gm" &
      "&chxl=0:|0|50|100&chxt=y&chs=200x120&chls=2|10" &
      "&chd=t:" & TEXT((Credit_Score__c)) &
      "&chl=" & TEXT(Credit_Score__c), "Credit Score Graphic"
),http://chart.apis.google.com/chart?
The following line specifies the chart type gm (Google-O-meter):
cht=gm
The following line sets the labels for the chart:
chxl=0:|0|50|100
The following line specifies using the Y-axis:
chxt=y
The following line sets the dimensions for the chart (width x height):
chs=200x120
The following line specifies the arrow line width and arrow head (2px line and small arrow head):
chls=2|10
The following line sets the data value passed to the graph (the data from the Credit Score field is passed):
chd=t:" & TEXT((Credit_Score__c))
The following line specifies the data label on the chart (the data from the Credit Score field is passed):
chl=" & TEXT(Credit_Score__c)
For more information to create other types of Google charts, navigate to:
http://imagecharteditor.appspot.com/
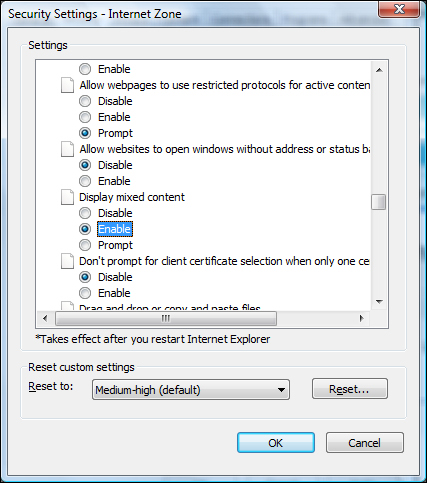
In Internet Explorer, there is security built in to check for HTTP/HTTPS mixed content. Salesforce uses HTTPS which is secure and as described earlier the Google Chart website uses HTTP which is not secured using SSL encryption. Internet Explorer may generate a warning for each user's browser which you can suppress using the following tip.
Tip
How do I suppress browser security warnings in Internet Explorer?
By default, Internet Explorer displays the following security warning message when a page contains a mixture of secure (HTTPS) and non-secure (HTTP) content:
This page contains both secure and non-secure items. Do you want to display the non secure items?
When you create a mash-up with a non-secure URL, users may see this warning message, depending on their browser security settings. To suppress this warning in Internet Explorer, follow these steps:
- From the Internet Explorer Tools menu, select Internet Options.
- Click on the Security tab and click on the Custom Level button.
- Finally, in the Miscellaneous section, set Display Mixed Content to Enable.
See the following screenshot: