 Using the Profiler to identify hot spots
by Stephen Whittle, William Sherif
Unreal Engine 4 Scripting with C++ Cookbook
Using the Profiler to identify hot spots
by Stephen Whittle, William Sherif
Unreal Engine 4 Scripting with C++ Cookbook
- Unreal Engine 4 Scripting with C++ Cookbook
- Table of Contents
- Unreal Engine 4 Scripting with C++ Cookbook
- Credits
- About the Authors
- About the Reviewer
- www.PacktPub.com
- Preface
- 1. UE4 Development Tools
- Introduction
- Installing Visual Studio
- Creating and building your first C++ project in Visual Studio
- Changing the code font and color in Visual Studio
- Extension – changing the color theme in Visual Studio
- Formatting your code (Autocomplete settings) in Visual Studio
- Shortcut keys in Visual Studio
- Extended mouse usage in Visual Studio
- UE4 – installation
- UE4 – first project
- UE4 – creating your first level
- UE4 – logging with UE_LOG
- UE4 – making an FString from FStrings and other variables
- Project management on GitHub – getting your Source Control
- Project management on GitHub – using the Issue Tracker
- Project management on VisualStudio.com – managing the tasks in your project
- Project management on VisualStudio.com – constructing user stories and tasks
- 2. Creating Classes
- Introduction
- Making a UCLASS – deriving from UObject
- Creating a user-editable UPROPERTY
- Accessing a UPROPERTY from Blueprints
- Specifying a UCLASS as the type of a UPROPERTY
- Creating a Blueprint from your custom UCLASS
- Instantiating UObject-derived classes (ConstructObject < > and NewObject < >)
- Destroying UObject-derived classes
- Creating a USTRUCT
- Creating a UENUM( )
- Creating a UFUNCTION
- 3. Memory Management and Smart Pointers
- Introduction
- Unmanaged memory – using malloc( )/free( )
- Unmanaged memory – using new/delete
- Managed memory – using NewObject< > and ConstructObject< >
- Managed memory – deallocating memory
- Managed memory – smart pointers (TSharedPtr, TWeakPtr, TAutoPtr) to track an object
- Using TScopedPointer to track an object
- Unreal's garbage collection system and UPROPERTY( )
- Forcing garbage collection
- Breakpoints and stepping through code
- Finding bugs and using call stacks
- Using the Profiler to identify hot spots
- 4. Actors and Components
- Introduction
- Creating a custom Actor in C++
- Instantiating an Actor using SpawnActor
- Destroying an Actor using Destroy and a Timer
- Destroying an Actor after a delay using SetLifeSpan
- Implementing the Actor functionality by composition
- Loading assets into components using FObjectFinder
- Implementing the Actor functionality by inheritance
- Attaching components to create a hierarchy
- Creating a custom Actor Component
- Creating a custom Scene Component
- Creating a custom Primitive Component
- Creating an InventoryComponent for an RPG
- Creating an OrbitingMovement Component
- Creating a building that spawns units
- 5. Handling Events and Delegates
- Handling events implemented via virtual functions
- Creating a delegate that is bound to a UFUNCTION
- Unregistering a delegate
- Creating a delegate that takes input parameters
- Passing payload data with a delegate binding
- Creating a multicast delegate
- Creating a custom Event
- Creating a Time of Day handler
- Creating a respawning pickup for an First Person Shooter
- 6. Input and Collision
- Introduction
- Axis Mappings – keyboard, mouse and gamepad directional input for an FPS character
- Axis Mappings – normalized input
- Action Mappings – one button responses for an FPS character
- Adding Axis and Action Mappings from C++
- Mouse UI input handling
- UMG keyboard UI shortcut keys
- Collision – letting objects pass through one another using Ignore
- Collision – picking up objects using Overlap
- Collision – preventing interpenetration using Block
- 7. Communication between Classes and Interfaces
- Introduction
- Creating a UInterface
- Implementing a UInterface on an object
- Checking if a class implements a UInterface
- Casting to a UInterface implemented in native code
- Calling native UInterface functions from C++
- Inheriting UInterface from one another
- Overriding UInterface functions in C++
- Exposing UInterface methods to Blueprint from a native base class
- Implementing UInterface functions in Blueprint
- Creating C++ UInterface function implementations that can be overridden in Blueprint
- Calling Blueprint-defined interface functions from C++
- Implementing a simple interaction system with UInterfaces
- 8. Integrating C++ and the Unreal Editor
- Introduction
- Using a class or struct as a blueprint variable
- Creating classes or structs that can be subclassed in Blueprint
- Creating functions that can be called in Blueprint
- Creating events that can be implemented in Blueprint
- Exposing multi-cast delegates to Blueprint
- Creating C++ enums that can be used in Blueprint
- Editing class properties in different places in the editor
- Making properties accessible in the Blueprint editor graph
- Responding to property – changed events from the editor
- Implementing a native code Construction Script
- Creating a new editor module
- Creating new toolbar buttons
- Creating new menu entries
- Creating a new editor window
- Creating a new Asset type
- Creating custom context menu entries for Assets
- Creating new console commands
- Creating a new graph pin visualizer for Blueprint
- Inspecting types with custom Details panels
- 9. User Interfaces – UI and UMG
- Introduction
- Drawing using Canvas
- Adding Slate Widgets to the screen
- Creating screen size-aware scaling for the UI
- Displaying and hiding a sheet of UMG elements in-game
- Attaching function calls to Slate events
- Use Data Binding with Unreal Motion Graphics
- Controlling widget appearance with Styles
- Create a custom SWidget/UWidget
- 10. AI for Controlling NPCs
- 11. Custom Materials and Shaders
- 12. Working with UE4 APIs
- Introduction
- Core/Logging API – Defining a custom log category
- Core/Logging API – FMessageLog to write messages to the Message Log
- Core/Math API – Rotation using FRotator
- Core/Math API – Rotation using FQuat
- Core/Math API – Rotation using FRotationMatrix to have one object face another
- Landscape API – Landscape generation with Perlin noise
- Foliage API – Adding trees procedurally to your level
- Landscape and Foliage API – Map generation using Landscape and Foliage APIs
- GameplayAbilities API – Triggering an actor's gameplay abilities with game controls
- GameplayAbilities API – Implementing stats with UAttributeSet
- GameplayAbilities API – Implementing buffs with GameplayEffect
- GameplayTags API – Attaching GameplayTags to an Actor
- GameplayTasks API – Making things happen with GameplayTasks
- HTTP API – Web request
- HTTP API – Progress bars
- Index
The C++ Profiler is extremely useful for finding sections of code that require a high amount of processing time. Using the Profiler can help you find sections of code to focus on during optimization. If you suspect that a region of code runs slowly, then you can actually confirm that it isn't slow if it doesn't appear highlighted in the Profiler.
- Go to Debug | Start Diagnostic Tools Without Debugging…
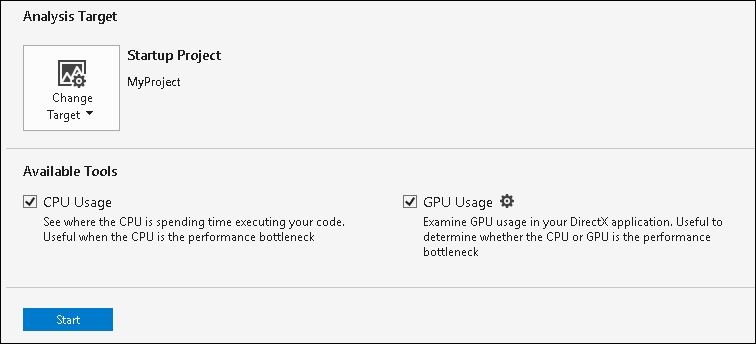
- In the dialog shown in the preceding screenshot, select the type of analysis you'd like displayed. You can choose to analyze CPU Usage, GPU Usage, Memory Usage, or step through a Performance Wizard to assist you in selecting what you want to see.
- Click on the Start button at the bottom of the dialog.
- Stop the code after a brief time (less than a minute or two) to halt sample collection.
- Inspect the results that appear in the
.diagsessionfile. Be sure to browse all available tabs that open up. Available tabs will vary depending on the type of analysis performed.
-
No Comment
..................Content has been hidden....................
You can't read the all page of ebook, please click here login for view all page.