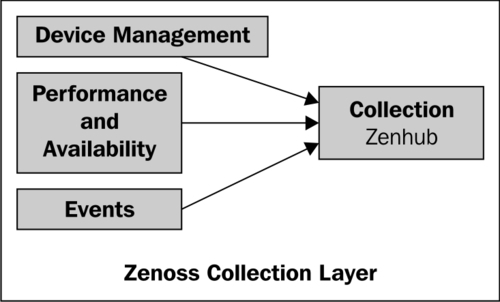
The collection layer includes several daemons that gather information about devices, performance, and Events. They feed information to ZenHub to distribute to the appropriate database. The Zenoss Core daemons are easy to identify—they all start with the prefix "zen".
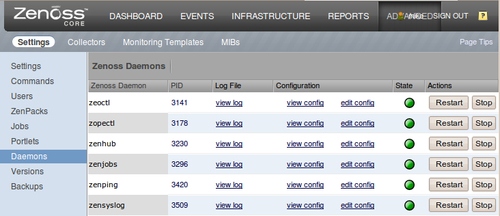
As the following screenshot illustrates, the Daemons page provides us with the complete view of the Zenoss Daemons that includes the process ID (PID) and up/down State. Green is up; red is down. From the interface, we can also view the Log File, edit the Configuration, and start and Stop each daemon.
If we browse the file system, we will find each daemon in $ZENHOME/bin. $ZENHOME is an environment variable, which allows us to talk about the Zenoss installation directory without knowing exactly where it is. For example, I may install to /usr/local/zenoss/zenoss while you install to /home/zenoss.
Twisted is an integral network communication protocol for the daemons. The Twisted Core README file describes Twisted as an "event-based framework for Internet applications"
Finding the devices on our networks is a prerequisite to managing them, and Zenoss Core not only finds the devices, it models them. Device modeling builds a detailed overview of the network by recording the following types of information: system dependencies, available services, and change history.
The following table describes the daemons responsible for discovering and modeling devices:
|
Device daemon |
Description |
|---|---|
|
|
Queries the devices via SSH/Telnet, SNMP, and port scans when we model the device. Each time |
|
|
Runs each time a request is made to discover a network or device. |
Zenoss uses SNMP as a primary collection protocol. However, it can also collect information via ICMP pings, port scans, and plugins.
The Zenoss Core performance and availability daemons help us determine if the devices on our network are available and performing within our established guidelines. If our monitored systems perform in an unexpected way, Zenoss Core generates an event.
The following daemons play an important role in collecting performance and availability data:
|
Performance daemon |
Description |
|---|---|
|
|
Stores the collected performance data in RRD files so that RRDtool can graph device performance over hourly, daily, weekly, monthly, or yearly durations. |
|
|
Provides a way to run custom scripts and third party plugins including Nagios and Cacti plugins from within Zenoss. |
|
|
Monitors the processes on Linux, Unix, and Windows systems. |
|
|
Pings a device and reports an up or down status to determine if a device is active or not. |
|
|
Tests the TCP ports and reports an up or down service. |
When a device goes down or a service crosses a predetermined threshold, such as available disk space, Zenoss Core generates an event. Events can generate a notification alert or run a custom command (to automatically take remedial action to fix the event, for example).
Not only can Zenoss Core generate its own events, but it can collect events from external sources (for example, custom system administration scripts) and convert the information to a "Zenoss-style" event.
The following table outlines the Zenoss Core event daemons:
|
Event daemon |
Description |
|---|---|
|
|
Creates events from syslog messages. |
|
|
Creates events from Windows event logs. |
|
|
Creates events from SNMP traps. When a problem occurs on a monitored device, it generates an SNMP trap to alert Zenoss of the problem. |