Now that we've invested time in configuring our monitoring environment, it's wise for us to review some Zenoss Core administration tasks. Most of the features we need to discuss will be found under the Advanced menu in Zenoss Core, but we'll also jump out to the command line several times.
In this chapter, we will:
- Manage Zenoss Core users
- Create custom user commands
- Configure Zenoss Core's dashboard
- Backup and restore monitoring data
- Update Zenoss Core
Let's get started with users and groups to round out the alerting discussion from the end of Chapter 7 , Collecting Events.
We should set up a username for each person who will be using Zenoss Core, and all the users should log in using their user account, not as the default admin user. Individual users can be granted the same privileges as the admin account. However, working as a non-admin with an individual user account has several benefits:
- Changes to settings are tracked via username
- Custom alerting rules can be defined per user
- Access permissions can be restricted per user
The initial setup created a user account and we've already configured that account with alerting rules in the previous chapter. Let's walk through the process of adding a user so we can review all the settings that are attached to a user.
- Select Advanced from the main menu.
- Select Users from the side bar.
- From the Users menu, select Add New User.
- Enter the User Name and Email address in the Add User dialog box.
- Click on Submit to create the user account.
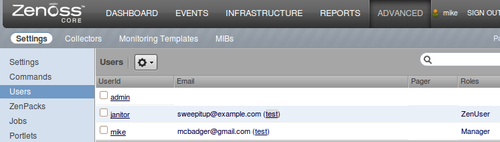
The new username is added to the list of users (see the following screenshot) along with columns for Email address, Pager, UserID, and Roles.
Before a new user can log in, we must specify a password. To create a password and configure the account, edit the user account by clicking on the username from the Users table. The following table includes the fields we can set via the Edit Screen:
|
Property |
Description |
|---|---|
|
Password |
Specify the new password in the first text field. Retype the password in the second box and click on Save to verify if the passwords match. |
|
Roles |
Specify a user role. Available options are Manager, ZenManager, and ZenUser. |
|
Groups |
If the user is a member of a defined group, select it. Groups are defined in Settings | Users. |
|
|
Enter an e-mail address if the user has to receive alerts via e-mail. |
|
Test |
Click the test link to send an e-mail to the e-mail address specified. |
|
Pager |
Enter a pager number if the user will receive alerts via a pager. |
|
Default Page Size |
Specify number of entries displayed in a grid listing. Default is 40. |
|
Default Admin Role |
Select the default role for administered objects. |
|
Default Admin Level |
This field is not currently used and is reserved for future use. |
|
Dashboard Refresh |
Enter the time in seconds between dashboard refreshes for the user. The default is 30 seconds. |
|
Dashboard Timeout |
Enter the time in seconds before the dashboard refresh times out. The default is 25 seconds. |
|
Dashboard Organizer |
Select the organizer view for the Device Issues dashboard portlet. The user can change or select a new organizer via the Preferences link. Available options include: Devices Systems Groups Locations |
|
Network Map Start Object |
Specify a default network from the monitored networks to map on the Network Maps view. For example, 192.168.1.1. |
In order to save any changes, the user making the changes must type his password into the field labeled Enter your password to confirm changes.
We use roles to define a user's level of access to the system. The following table lists the available roles from the most to the least restrictive access:
|
Role |
Access Privileges |
|---|---|
|
ZenUser |
View-only access to the system. Includes the Dashboard, Device List, Browse by organizers, and classes. |
|
ZenManager |
Access includes view, update, and delete. User is able to access the Management menu items and Event Console. |
For each user, we can assign a list of administered objects, which includes devices, systems, groups, device classes, and locations. By matching users to administered objects, we have an easy way to identify who is responsible for the object. Any user with administrative rights can match users to administered objects.
To view or edit the administered objects for a user, click on the Administered Objects menu while editing a user account.
To add an object:
- Choose the appropriate option from the Administered Objects menu.
- If we add a device, the Add Device dialog box filters the list of devices as we type.
- If we add a system, group, or location, we can choose the object from a drop-down list.
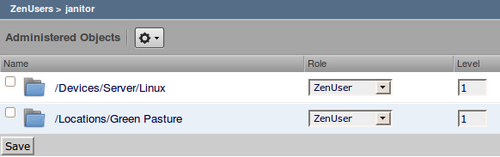
The following screenshot shows that our test user, janitor, is responsible for the Linux servers and the Green Pasture location.
A quirk with the administered objects is that if you assign a class to a user, the administered objects are not inherited (at least it's not displayed) at the device level. This means that if I have a device classified in /Server/Linux, the Administration page for the device will not show the user janitor (in keeping with this example) as an administrator.
If we click on the object name, Zenoss Core displays the status page for the device, system, group, class, or location. And on the Details page, there will be an Administration link. The following screenshot shows the Administration details for the /Server/Linux class and guess what you see under the Administrators heading?
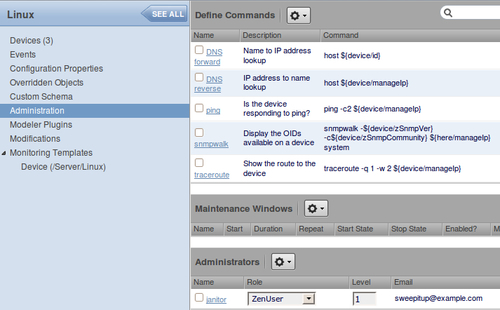
The screenshot shows that the administrator for this device class is the username janitor, which is the assignment we just made. Now we know who to contact with questions about this device class. You may be wondering if you need to match up users with administered objects. Just because we have the capability doesn't mean we have the need. In my monitoring environments, I'm usually the only person who cares about monitoring. So, I administer everything. If you have a larger installation with multiple system administrators and want to use Zenoss Core as a way to track some detailed information about your device inventory, this might be an appropriate feature. The username in the Administrators list is a hyperlink that will take us back to an overview of the user.
Zenoss Core enables each user to define a custom event view which will modify how that user sees the Event Consoles. We can filter the event view by a set of device and event-specific criteria, such as device class, production state, IP address, location, or severity, to name a few possibilities.
To define a custom event view for a user:
- Edit the user account.
- Select the Event Views link in the sidebar.
- From the Event Views menu, select Add Event View.
- Enter a descriptive name in the Add Event View dialog box.
- Click on Submit to add the event view.
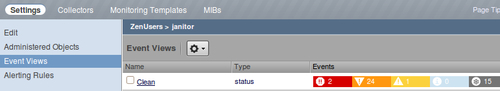
By default, the newly-created event view looks identical to the Event Console. Click on the event view name to edit the properties, as seen in the following screenshot:
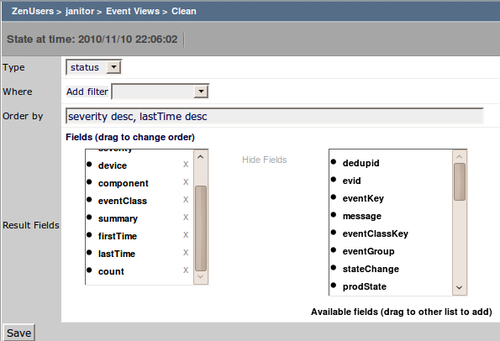
The following table describes the available options for the Event Views:
|
Property |
Description |
|---|---|
|
Type |
Select status to display active events and history to display cleared events. |
|
Where |
Build the filtering rules for the event view. For example, Device is Coyote. |
|
Order by |
Specify the default sort order. Sort orders are specified in pairs by field and order. Each sort order is comma separated. For example, if we specify a sort order equal to severity desc, count asc, the event view lists all the events from the most severe to the least severe. Within each severity, the view sorts by the count field in ascending order. |
|
Result Fields |
Add and remove fields to the event view. |
Everything that we have been configuring on a per user basis can also be configured on a group basis, including alerting rules, administered objects, and event views. Groups streamline our user management tasks by allowing us to configure a single set of properties and then assign users to the group. The users inherit the group's properties. You can override a group setting at the user level.
Configuring alerting rules, event views, and administered objects for a group is the same as for a user. Therefore, we won't step through any examples.