Zenoss Core includes several reports that allow us to view and export status and performance information about the devices and components we monitor. Using these reports, we can troubleshoot problems, brief management, provide justification for system upgrades, or view data over time for further analysis.
In this chapter, we'll review each of the included reports, as well as create a custom graph and multi-graph reports.
To see a list of the default report classes, select Reports from the navigation menu. The report classes we will cover are:
- Device Reports
- Event Reports
- Graph Reports
- Multi-Graph Reports
- Performance Reports
- User Reports
The following screenshot shows the available reports:
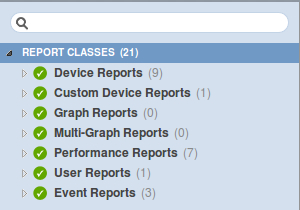
As you see from the screenshot, the report classes display in the sidebar and expand to display the individual reports contained in the class.
Most of the reports share common functionality. For example, all reports include a search box that allows you to find specific information based on the data the report shows. Each report also includes an export all button that creates a CSV file of the current report view. As we move through the reports, you'll notice that many of the reports include report-specific selection criteria.