The performance reports include a mix of the following graphs and text-based reports:
The Aggregate Report shows the performance graphs that combine data from all the devices into one graph, which allows us to view the cumulative performance for a component. The available aggregate reports include CPU Use, Free Memory, Free Swap, and Network Input/Output. We can customize how each graph is displayed by changing the graph parameters. To make changes, click on the graph image to open the parameters window (as shown in the following screenshot):
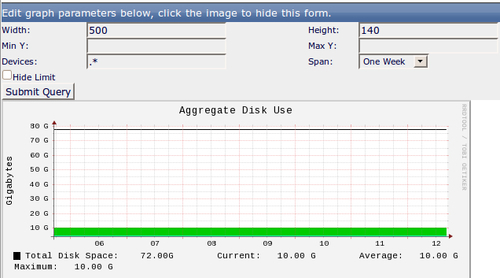
We can control the size of the graph by specifying a new Width and Height in pixels. In addition, we can set new minimum and maximum values for the y-axis that correspond to the unit of measurement for each graph. By default, all the devices are included, but we can view the graph for a single device by entering the device name in the Devices field.
The default time Span for the graph is One Week, but we may choose one day, two weeks, one month, or one year. After making the selections, press the Submit Query button to redraw the graph based on the new parameters.
The Availability report lists each device in the inventory along with its Systems organizer. The availability is calculated for the selected Event Class and Severity:
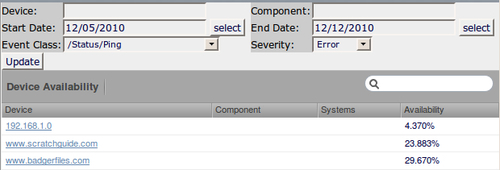
The default report gives us the availability percentage for the past seven days for the /Status/Ping event class based on a Severity of Error. We can change the reporting criteria based on the following options:
|
Report Filter |
Description |
|---|---|
|
Device |
Enter a device name to limit the report to a single device. |
|
Component |
Enter a component name from the device OS tab. Zenoss returns devices that match with the specified component. |
|
Start Date |
Specify the first day of the report. |
|
End Date |
Specify the last day of the report |
|
Event Class |
Select the type of the event to report on. For example: |
|
Severity |
Select the event severity to use when calculating availability. |
After we enter the report criteria, we can click on the Update button to view the new report.
The CPU Utilization provides the Load Average and the Percent Utilization for each device. If Zenoss Core is not collecting CPU performance statistics for a device, the Load Average and Percent Utilization values display as N/A (refer to the following screen shot):

By default, the report displays the previous seven days. However, we can specify a custom Start Date and End Date for the report. We can also choose one of the following for Summary Type: Maximum or Average. Maximum displays the maximum Load Average and Percent Utilization for the date range while the Average summary type provides average Load Average and Percent Utilization calculations.
All monitored file systems are included in the Filesystem Utilization report. For each file system Mount point, the report includes the Device, Total bytes, Used bytes, Free bytes, and Percent Utilization (as seen in the next screenshot). If Zenoss Core does not know a value, it populates the report values with N/A.

The default date range of the report includes the previous seven days, but we can specify our own Start and End Dates. We can further filter the report output by showing the Maximum or Average usage statistics by choosing the appropriate option from the Summary Type.
This report gives us a single view of file system utilization site-wide or across a single class, which may help identify the need for more disk space.
The Interface Utilization Report (seen in the following screenshot) includes all monitored interfaces. For each Interface, the report includes the Device, Speed, Input, Output, Total throughput, and Percent Utilization. The report lists N/A for any unknown values.
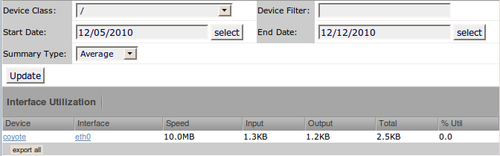
The default date range of the report includes the previous seven days, but we can specify our own Start and End Dates. We can further filter the report output by showing the Maximum or Average usage statistics by choosing the appropriate option from the Summary Type.
The Memory Utilization Report (see the next screenshot) includes all the devices and provides the following memory statistics: Total, Available, Cached, Buffered, and Percent Utilization. Like several of the performance reports, known values are displayed, while N/A is displayed for unknown values.
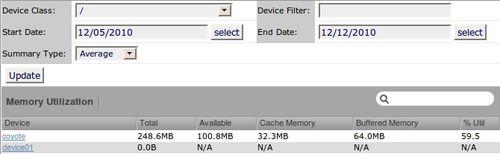
The default date range of the report includes the previous seven days, but we can specify our own Start Date and End Date. We can further filter the report output by showing the Maximum or Average usage statistics by choosing the appropriate option from the Summary Type.
To see a list of the devices that have crossed their performance threshold, we run the Threshold Summary Report (refer to the following screenshot). For each Component listed, the report includes the Device, Event Class, and a Count of the threshold violations, the Duration, and Percent Utilization:

The report displays the previous seven days by default, but we can specify a custom Start Date and End Date. The default Class is /Perf, which includes all the performance class events. However, we can limit the report to the following event subclasses: /Perf/CPU, /Perf/Memory, /Perf/Filesystem, /Perf/Interface, /Perf/Snmp, and /Perf/XmlRpc.