
In the previous chapter, we reviewed each of Zenoss Core's canned reports, and even though we could customize some of them, we were still constrained as to what each report could contain. In this chapter, we're going to query the Zenoss Core data model to create custom reports. And we'll do it from the graphical interface provided by the Custom Device Report interface. Our topics include:
- Custom Device Reports and how to use
zendmdto explore the data model - Scheduled report delivery with
reportmail
Let's start with a simple custom device report.
When you view the Reports page in Zenoss Core, you should notice an empty report class called Custom Device Reports. The custom device report provides an interface that lets us query Zenoss Core for devices. Each device that matches the query is listed as a row on the report.
Let's get started with a simple report to show uptime values for all devices, and then we'll talk through the options.
With the Custom Device Reports organizer selected:
- Select Add Custom Device Report from the Add Report button (at the bottom of the Report Classes sidebar.
- In the Create Custom Device Report dialog, type a name for your report in the ID field. I'm going to use Uptime. When you click on Submit, the edit screen is displayed.
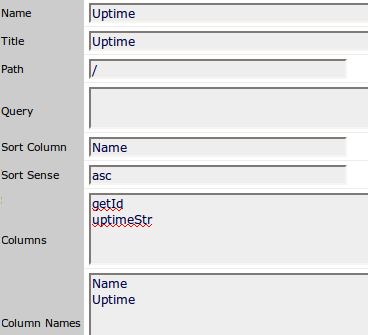
- Enter the following values for the Uptime report, as seen in the following screenshot. Leave all other fields set to their default values.
- Title: Uptime
- Sort Column: Name
- Columns: uptimeStr, getId
- To view the report, click the Save button, and then click the View Report link (in the sidebar).
The following screenshot shows the edit screen of our report:
The next screenshot shows what our report looks like when we view it:
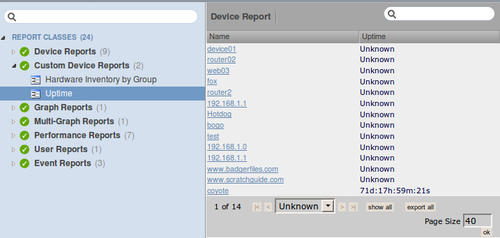
As you see, we created a simple report that lists each device along with its uptime value. In this report, we use the Column field to do the heavy lifting. We specified the device attributes of uptimeStr and getId, which give us a human readable value of the device's uptime and the name of the device, respectively.
Note
A good place to find device attributes is in Appendix B, Device Attributes which lists common attributes you can use with TALES expressions.
Our report shows columns for Name and Uptime, which are the values we specified in the Column Names field. For each attribute specified in the Columns field, we can define a corresponding friendly Column Name. List the column names in the same sequence as the columns.
Now that we've seen how easy it is to get started with a simple report, we'll preface our more involved examples by reviewing the available report fields.
The following table shows the available fields on the custom device reports:
|
Field |
Description |
Example |
|---|---|---|
|
Name |
Descriptive name for the report. The name doesn't display on the report. |
Uptime |
|
Title |
The title displays on the report. |
Uptime Report |
|
Path |
Specify the device class to query. The default is /, which will include all devices. |
/Server/Linux |
|
Query |
Use the query field to filter and select data. Accepts a python or TALES expression.
Leave blank to select all devices. |
here.hw.cpus.countObjects() > 0
here.sysUpTime() > -1
here.comments != "" |
|
Sort Column |
Specify the column that the report is sorted on. Can either be the Column or Column Name value. |
Name getId |
|
Sort Sense |
Apply the specific sort order to the value in Sort Column. Can either be ascending or descending. |
asc desc |
|
Columns |
Specify the data to display for each device returned in the query. This can take a device attribute or a python expression. Python expressions must be prefaced with |
UptimeStr python:dev.hw.totalMemoryString() |
|
Column Names |
Define the human-friendly names that correspond to each value you entered in Columns. Enter one value per line. |
Uptime Total Memory |
There is minimal error checking done on the data you enter. If you enter a query with an invalid syntax, the View Report option will tell you about the error.
If you enter more column names than you specify columns, the interface will turn all the column names red when you save the report.
Let's refine our uptime report a bit more, so we can figure out exactly how we can build meaningful queries.
Our current version of the uptime report returns the uptime value for each device. Because we didn't specify a query, the report includes all devices and shows us values for devices that aren't reporting an uptime. That's what all the "Unknown" values are on the report.
To improve our report, let's exclude those devices from our report. The query that will exclude devices with an unknown system uptime is:
here.uptimeStr() != "Unknown"
Let's examine the query from left to right. The here portion evaluates the expression on the currently selected device. The custom device reports will retrieve all devices that are included in the specified Path.
The here.uptimeStr() != "Unknown" query returns the system uptime value for the selected device and checks to see if it is not equal to "Unknown". If the statement evaluates to true, then the device is included in the report.
But how do you know which query to use when building a report? To help us build queries, we turn to the interactive shell zendmd.
We got our first look at zendmd in Chapter 7, Collecting Events as a resource for determining event transformations, and it came up again in Chapter 9, Extending Zenoss Core with ZenPacks when we talked about programming ZenPacks. We're going to explore the zendmd shell a bit deeper this time to help us figure out how we can identify the devices with unknown system uptime values.
As the zenoss user, run zendmd. Let's start with a device that we know is reporting uptime. In my test network, that device name is Coyote. We'll run through the command and then we'll talk about what happened.
From zendmd, run the following commands:
d = find("Coyote")
Hopefully, you remembered to use a device on your network. otherwise, your assignment will fail. You can check to see what's assigned to the variable d with the command:
print d
If that command returns the value None, you need to retry your find command using a correct device name. Don't forget to wrap the device name you want to find in quotes.
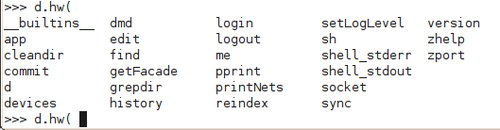
Now we need to figure out which object holds the uptime value. Zendmd has a built-in auto-complete feature. So, if you type this command, you will see all the available methods that you can run against the device:
d.<tab> <tab> <y>
Pressing the Tab key twice is the way to get zendmd to auto-complete the command. In this scenario, it will ask if you want to display all 605 possibilities. Pressing y for yes will page through the results.
Unless you're bored, you may not want to page through hundreds of pages of possible objects. It's probably more fruitful to guess at the first letter of the object you need. In our uptime report, we use the uptimeStr attribute to display the system uptime value. So, give it a try:
d.u<tab> <tab>
The output is as follows:
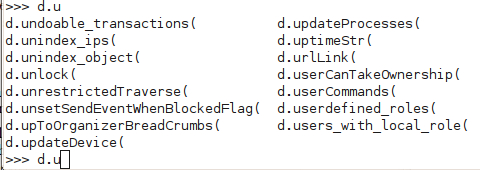
This command provides several methods that begin with the letter "u" and uptimeStr is one of the options. Let's finish out the command:
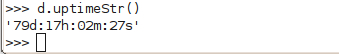
d.uptimeStr()
The result of the command is the uptime value for the device, as seen in the following screenshot:
So far so good, but we're actually looking for the opposite condition. Let's see what an unknown uptime value looks like. In my network, the device Fox is not reporting system uptime, so I can start the process over again:
d = find("Fox")
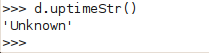
d.uptimeStr()
This results in an Unknown message, which is what we want to see:
At this point we have what we need to write our query for the custom device report or at least test it out. Edit the uptime report and enter this new value in the Query field: here.uptimeStr() != "Unknown".
Save and view the report. It works. All the devices that have an unknown system uptime value are excluded from the report.
What if we mistype the query and enter this instead: here.uptimeStr != "Unknown". Go ahead and give it a try.
The query brings back all devices, which means it's wrong. If you pop back into zendmd and run d.uptimeStr, you'll notice that you get an entirely different result than we did before. The lesson here is simple. The parentheses matter, so when in doubt, test the output of your functions with and without the parentheses.
Incidentally, this would be an equivalent query to exclude all unknown values: here.sysUpTime() > -1.
The sysUpTime function returns the uptime value in an integer format and -1 is equal to Unknown. The uptimeStr function translates the sysUpTime value to a friendly format. In other words, there may often be more than one way to get your data and a little exploration may lead to enlightenment.
What if you wanted to create a report that listed all devices with a serial number? What would that query look like? Try this:
here.hw.serialNumber != ""
Let's explore this command using auto-complete in zendmd. Type d.hw <tab><tab>. The following screenshot shows the result:
Notice that the there is an open parenthesis after hw. This is our cue in zendmd that we may be able to access other objects, so we replace the opening parenthesis with a dot and type the following command:
d.hw.s <tab><tab>
The output is as follows:
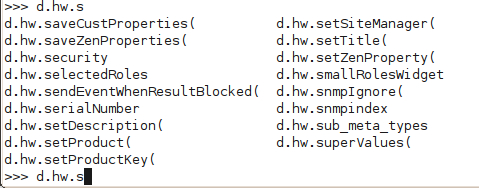
We see that serialNumber is one of our options. The other place we can find useful device data is in the os object, such as this report query:
here.os.filesystems.countObjects() > 0
This query will return all devices with a known file system, as seen in the Components section of the device overview. If we take that knowledge back to zendmd, we can interact with the os object to discover the data that might be available to us:
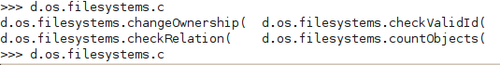
As the screenshot shows, the countObjects function is available from zendmd.
Are you wondering how we knew to look in the os and hw objects? To answer that question, let's turn back to the Zenoss Core web interface and briefly explore Zope, the framework that drives Zenoss Core.
Navigate to a device and note the URL. When I navigate to my favorite device, Coyote, here is the URL I see: http://localhost:8080/zport/dmd/Devices/Server/Linux/devices/coyote/devicedetail#deviceDetailNav:device_overview.
Your hostname and device name will vary, but you should see something similar. Replace /devicedetail#deviceDetailNav:device_overview with /manage so that the new URL looks like this: http://localhost:8080/zport/dmd/Devices/Server/Linux/devices/coyote/manage.
When you press return, should you see a screen that resembles the following screenshot:
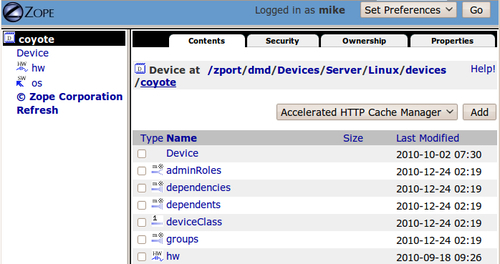
If we direct our attention to the left sidebar, we see the data structure that we just explored from zendmd. We see that hw and os are children of Device. To view the final piece of this puzzle, click on the hw link, and then click on the Properties tab:
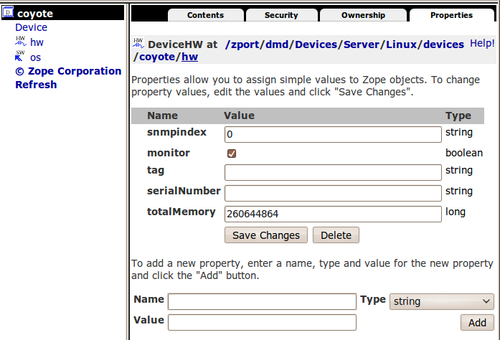
As we see in the screenshot, serialNumber is a property of hw.
Using Zope is just a different way to visualize the Zenoss Core data. We happen to be talking about custom device reports, but this could be useful for other Zenoss Core programming tasks as well.
Let's get back to the custom device reports, so we can review how to evaluate python expressions in the column data.
The custom device report allows us to specify a Python expression for each column on the report. The expression must be prefaced with python:.
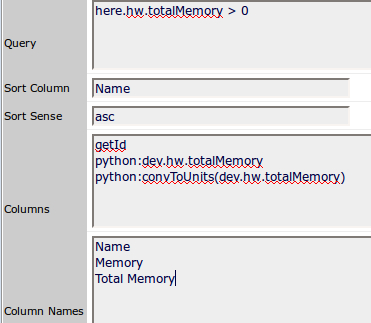
To demonstrate, let's run a report that pulls all devices with monitored memory values, using this query:
here.hw.totalMemory > 0
Enter the following values for Columns:
- getId
- python:dev.hw.totalMemory
- python:convToUnits(dev.hw.totalMemory)
For the Column Names, specify Name, Memory, and Total Memory, respectively.
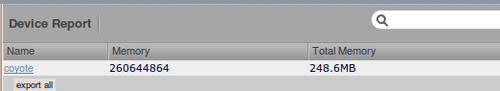
Save and the view the report.
When we run the report, we see that for each device with a totalMemory property, we're printing the total memory value as an integer and in a human readable format, as seen in the following screenshot:
Before we talk about the convToUnits function, note how we reference the device in the Python expression. In the context of the report columns, we use the variable dev to access the device. Recall that we use the here variable when writing a query, but this expression will fail as a column expression:
python: here.hw.totalMemory # not correct
In place of the variable dev, we could also use device, but why type three extra letters if we don't have to?
Now, what about convToUnits? When we work with custom device reports, we have access to a couple of "convenience" functions.
In the preceding report, we use the convToUnits function to turn the totalMemory value into something human readable. Sample usage follows.
The convToUnits function converts a number to its human-readable format (for example, 4GM, 128MB, 2.1GHz, and so on). We can supply it with the number to convert, the number to divide by, and a unit string:
convToUnits(number=0, divby=1024, unitstr="B")
If we give the function a number, such as the totalMemory value, it will automatically divide the number by 1024 and append a "B" to the units. We can change all three values if we need to, as the following usage shows:
convToUnits(123456789, 1000, "Hz")
The divby number should be self-evident and answers the question, "what value do I need to divide my number by in order to obtain a readable result?". The unitstr value needs some further explanation.
By default, the function will evaluate the unit in terms of 'K','M','G','T', and 'P'. The unitstr value you specify is appended to the evaluated unit. So if you specify Hz as the unitstr, then your potential units become KHz, MHz, GHz, and so on when the function evaluates the number.