When a user logs in, Zenoss Core opens to a Dashboard, which contains a list of configurable, drag-and-drop portlets. Portlets are widgets that provide an overview of our monitoring environment.
We can choose from the following portlets:
- Locations (Google Maps)
- Device Issues
- Zenoss Issues
- Top Level Organizers
- Watch List
- Production States
- Site Window
- Messages
Note
For some tips on writing a custom dashboard portlet, see the Zenoss Core developers guide at http://community.zenoss.org/community/documentation/official_documentation/zenoss-dev-guide.
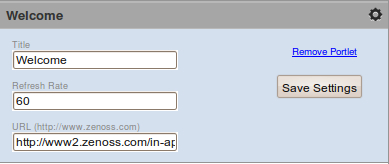
The Location, Device Issues, and Site Window (Welcome) portlets display by default, but we can remove any of them by clicking on the asterisk at the top-right corner of the portlet to show a settings panel, as seen in the following screenshot. From the settings panel, choose the Remove Portlet link:
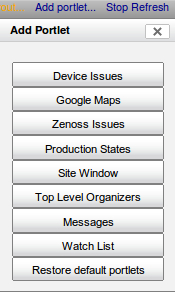
To add a portlet, click on the Add Portlet link at the top of the Dashboard. From the Add Portlet dialog box that is displayed, select the portlet you want to see on the Dashboard (refer to the following screenshot):
To arrange the portlets, click on the Configure Layout link at the top of the Dashboard to display the Column Layout dialog box. We can choose from various combinations of one, two, and three column arrangements. After we choose a layout, we can rearrange the order of the portlets on the screen by dragging and dropping a portlet to a new position on the screen.
You've probably noticed by now that the Locations portlet is complaining about a missing Google Maps API key. Let's set that up now and then we'll review each of the available portlets.
The Locations portlet makes great eye candy as it will display a point on the map for each location, link the locations, and show the highest severity event at each location.
In order to make the Locations portlet work, we need to add a Google Maps API key to the Zenoss settings. To acquire a free Google Maps API key:
Visit http://www.google.com/apis/maps/signup.html and follow the registration procedure:
- When prompted for a site URL, specify the URL of your Zenoss Core server, including the port number (for example, http://localhost:8080).
- Copy the key.
- In Zenoss Core, click on the Advanced menu and paste the key into the Google API field on the Settings page.
- Save the changes.
Now when you navigate back to the Dashboard and view the Locations portlet, a map displays. Each location organizer we add to Zenoss Core has an Address field. We added locations in Chapter 3,
To edit the address of a location, select the name of the location from the Devices page, which can be found under the Infrastructure menu. Then from the Actions menu, select Edit to display the Edit Organizer dialog box, seen in the following screenshot:
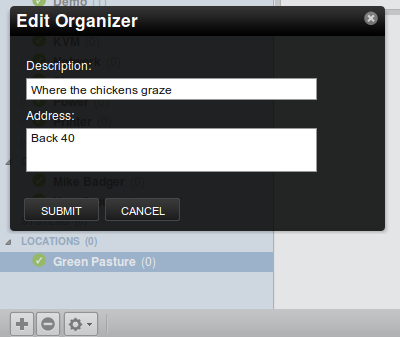
Specify an Address that Google Maps will understand, which means it's a good idea to test the address out in Google Maps so you can see what Google returns for the address you enter.
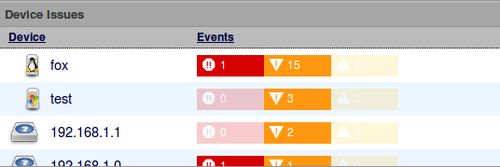
The Device Issues portlet displays a list of all devices with an event using a color-coded status. Each device name is a hyperlink that links to the device's main status page. Likewise, clicking on the event redirects us to the event page for each device.
We can modify the portlet Title and Refresh Rate from the settings pane.
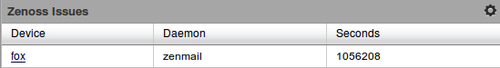
Zenoss Core not only monitors our network but it monitors itself. If one of the daemons has a problem, Zenoss Core displays that problem in the Zenoss Issues portlet:
Like the Device Issues portlet, we can only change the portlet Title and Refresh Rate.
With the Watch List portlet we can monitor the status of a device class hierarchy. If a device in the selected class generates an event, the status updates on the Watch List portlet.
To watch a device class, select the class from the Zenoss Objects drop-down menu that appears in the portlet settings pane. We can also change the Title and Refresh Rate. The following screenshot shows the Watch List portlet with the settings pane expanded:
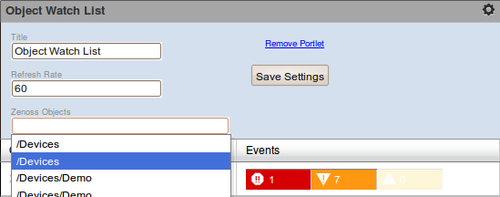
The Zenoss Objects field is a drop-down list of device classes.
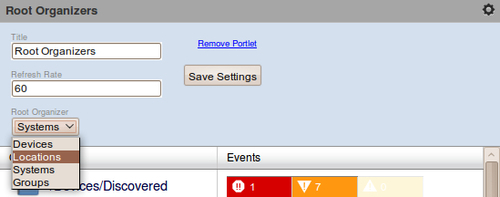
The Root Organizers portlet displays the status for the grouping we choose (locations, systems, groups, and devices). The default organizer is devices.
If you want to select a new Root Organizer, choose the new organizer from the settings pane of the portlet, as seen in the following screenshot:
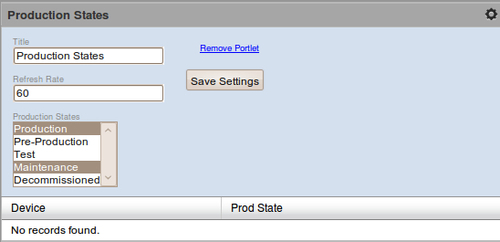
The Production States portlet displays the Devices assigned to the selected Production State. Default Production States are Production, Pre-Production, Test, Maintenance, and Decommissioned.
Select the Production States to display from the settings pane. To monitor multiple states, hold down the Ctrl key while selecting the states.
We can restrict which users see which dashboard portlets by setting permissions on the Portlets page in the Advanced menu. We can choose from three levels:
- Users with Manage DMD permission
- Users with View permission
- Users with ZenCommon permission

The three permission levels correspond to available Zenoss Core user roles: Manager, ZenManager, and ZenUser.
If you want to restrict users within the ZenUsers role from seeing a dashboard portlet, assign the portlet Users with Manage DMD permission. Users who are members of either the Manager or ZenManager role will be able to see all the device portlets regardless of the set permission.