Zenoss Core creates time series graphs using the RRDTool for the device and its components. "Time series" implies that we continuously measure data at regular intervals.
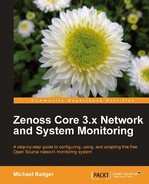
Devices may have graphs to display CPU utilization, load average, memory utilization, and IO. To display these graphs, navigate to a device and click on the Graphs link. See the following screenshot:
The other place we find performance graphs is at the Component level, which we've been discussing.
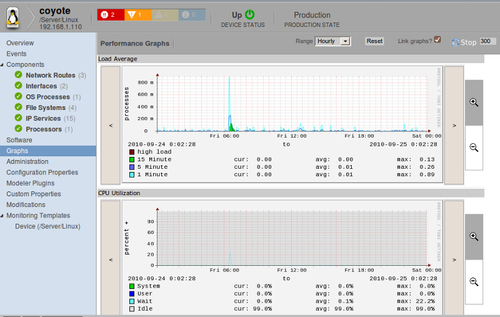
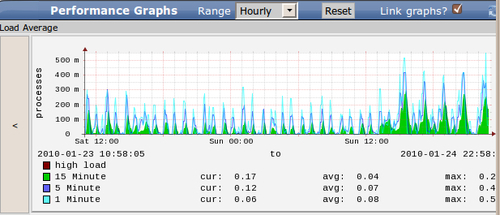
All performance graphs function in the same way. They can be viewed on an hourly, daily, weekly, monthly, or yearly range. The default Range is Hourly (see the following screenshot):
Each group of graphs has a Reset button that restores all the graphs on a page to the default view. The Link graphs checkbox allows all the graphs on the page to stay synchronized as we navigate through the time line of an individual graph.
Each graph also has its own set of controls. On either side of the graph, we have time line navigation controls. The< navigates backward through the date range while the> navigates forward. The magnifying glasses allow us to zoom in and out on the graph. To zoom in, click the +, and then move the cursor over the graph. When the cursor turns to a cross hair, click the mouse button to zoom in. The same process applies to zoom out, except that we select the - magnifying glass.
The layout of each graph also follows a common format. The time measurement plots on the x axis and the data point being measured plots on the y-axis. Beneath the x-axis, the graph identifies the visible time range.
At the bottom of the graph, we see the color-coded data points represented on the graph. Each data point displays current, average, and maximum measurements for the visible time range.
Defining which data points a graph displays is controlled in the performance template that is bound to the device. Collecting data via data points will be a central topic in Chapter 5,
Monitoring and graphing performance is related to monitoring a component for a specific threshold. For example, if a file system exceeds certain utilization, Zenoss Core can create an event to alert us of the state of the system.
By default, Zenoss Core has several default thresholds established via the performance templates. Some thresholds are as follows:
- File system: 90 % utilization on
/Deviceclass - Interface: 75 % utilization on
/Deviceclass - CPU percentage: Less than 2 % on
/Deviceclass - CPU high load: Greater than 1200 on
/Device/Linuxclass
In order to change or add to our graphs, including thresholds, we modify the device's performance template, which we will do in the next chapter.