Do you have a bunch of homegrown system administration scripts running on your network? Wouldn't it be nice to monitor the activities of those scripts? Zenoss Core ships with a stand alone script called zensendevent that we can integrate into our existing scripts in order to use Zenoss Core's event systems.
Note
We can install zensendevent on any server (or desktop) as long as the system has Python installed.
A sample use would be to use zensendevent to create events to document the progress of a backup script by generating an informational event at the start and a clear event after the script completes.
We'll work up a simple example, but first let's use zensendevent to generate some events from a command line. To see what options are available, run the following command from a command line as the zenoss user:
zensendevent ‑‑help
As you look over the usage summary, you should recognize most of the available options from our previous topics. Among the familiar items that we can recognize are device, ipAddress, event key, event class, and component.
Let's run a test command:
zensendevent -d bogo -s Warn -v "I like pie"
The following screenshot shows the output of the command:
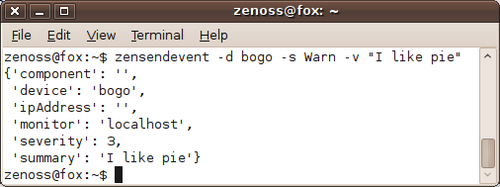
There are not really any surprises in this command. We created an event for the device named bogo with a severity of warning. The summary of the event is I like pie. Hey, it's getting lonely writing about network monitoring late at night. My mind likes to wander to pie. Feel free to substitute your own silliness. The -v option shows the verbose output, which is showing us the information that was sent to Zenoss Core.
Let's look at the events for our bogo device in Zenoss Core:
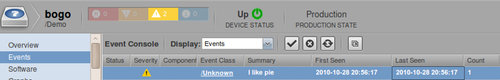
Once we get that event into Zenoss Core we can leverage Zenoss's event handling system, which we talked about in the previous chapter. Perhaps more importantly, we can now use Zenoss Core's alerting system, which we will set up at the end of this chapter. We could also transform the event, also coming up in this chapter.
Or we could just take a moment to reflect on the world of opportunity we've just unlocked:
Let's run one more test command using a device that doesn't exist in Zenoss Core's inventory:
zensendevent -d dedkat -s Warn -v "Better do CPR"
The following screenshot shows Zenoss Core's event console:

Note that the event name dedkat is not a clickable link, but it still shows up in the Event Console. It's not clickable because it's not a device in the inventory. The point of showing this was just to show that you can feed Zenoss Core a lot of information, which could be used to report some high level monitoring aspect not tied to a device or to have a new server automatically report system information to Zenoss Core for use in configuring the device in Zenoss Core. (Thank you to my technical reviewers, Jonny and Charlie for providing some ideas.)
Let's take a look at a real world use for zensendevent by incorporating it into a script that backs up our Zenoss Core data:
#!/bin/sh
	zenbackup --save-mysql-access 2> $HOME/backups/zenbackup.log
	STATUS=$(echo $?)
	if [ "$STATUS" = "0" ]; then
	zensendevent -d fox -k backup -s Info -c /Status/Update "Zenoss backup successful"
	else
	zensendevent -d fox -k backup -s Warn -c /Status/Update "Zenoss backup failed"
fi
The script itself is fairly simple. It runs a Zenoss file called zenbackup which will automatically write backups to /home/zenoss/backups. We use zensendevent to create an event. If the zenbackup command completes successfully, we set a severity of informational, and if it fails, we set the severity to warning.
The biggest shortcoming of this script is that it doesn't alert you if the backup fails to run, which could be a problem for some. Feel free to adapt this script as you see fit.
I suspect many readers probably have similar scripts that send e-mails if there is a problem, so you might wonder why we'd want to go through the trouble of directing the data to Zenoss Core. As we already discussed, Zenoss Core provides a centralized place to collect and alert on our events. Zenoss Core will also maintain an event history and we can write custom reports to view that history.