Alerts are the final piece of our core monitoring setup, if you need or want them. Events trigger alerts, and alerts notify a human about a problem. We attach alerts to users or groups of users. Configuring alerts for users and groups require the same basic steps, so we'll demonstrate the alerting rules for a user. If you opt not to set up e-mail or pager alerting rules, Zenoss Core will continue to monitor devices and generate events that will be visible in the Event Console.
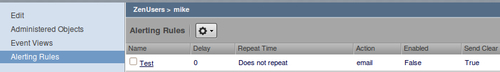
To add an alerting rule, first edit the user. Select the Alerting Rules tab (see the following screenshot) while editing the username to display the list of rules assigned to the user.
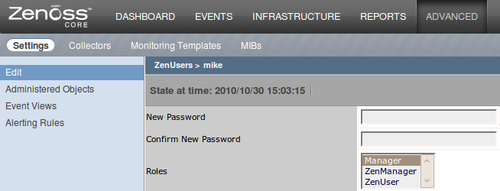
- From the Advanced menu, select Settings and then Users to display a list of users. You should see a list of users that includes the admin user and the user you defined during installation.
- Edit a user (other than admin) by clicking on the name. The properties for the user account will be displayed:
- From the sidebar, click on the Alerting Rules menu. A blank Alerting Rules page will be displayed.
- Select Add Alerting Rule from the Alerting Rules menu. The Add Alerting Rule dialog box will be displayed.
- In the Add Alerting Rule dialog box, type a name for the rule (for example, Test). Click the OK button to add the rule. At this point the rule is disabled.
- To enable the rule, click on the rule name to display the properties.
- Select True from the Enabled drop-down list.
- Click on Save to enable the alerting rule.
At this point we have an alerting rule with some default settings. The default rule sends an e-mail when any device in a Production State generates a new event with a Severity level equal to or greater than Error. Zenoss also sends an alert when the event clears.
We can do so much more. Let's take a look at the alerting rule properties:
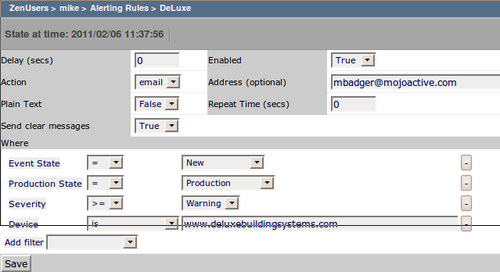
The properties are explained in the following table:
|
Property |
Description |
|---|---|
|
Delay (secs) |
Delay sending the alert for the specified time. Default is 0. |
|
Enabled |
Set to True to enable the alert. If the value is False, this rule does not send alerts. |
|
Action |
Choose either email or pager notifications. |
|
Address (optional) |
Specify any valid e-mail address. If left blank, the e-mail address specified for the user is used. |
|
Send clear messages |
Select True to send alerts when the event clears. Select False to suppress clear messages. |
|
Repeat Time (secs) |
Repeat the alerting rule for the specified time. Default is 0. |
|
Where |
Select the alert filter criteria. Add and remove filters as needed. |
By adding filters to the alerting rule, we can create very specific alerting conditions. Let's take a closer look at the alert filters.
An alert filter consists of three parts: an event field, a comparison operator, and a value to compare to the event field. The following screenshot shows the default filters for a new rule:
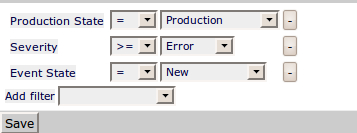
In the screenshot, Production State, Severity, and Event State are the event fields. The middle column of drop-downs with the = and>= signs are the comparison operators, and the third column shows the available values that can be assigned to the event fields.
The Add filter drop-down list contains a list of available event fields:
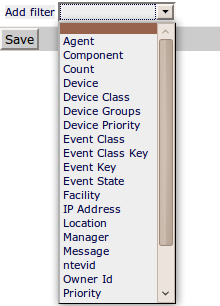
You can find each of these items with a corresponding description listed in Appendix A Event Attributes.
The more filters we add to a rule, the more specific our alerting rule becomes. A common practice with alerts is to build an alert escalation. For example, we can create a rule that says, if a new event remains unacknowledged after five consecutive times, then trigger a new alert. Five is an arbitrary number.
Let's add an escalation for our default alerting rule.
Alert escalation is a broad term that commonly refers to the act of increasing the severity of an event or notifying a different person about an event. For a quick example, we'll create an alerting rule to notify a backup contact person regarding an unacknowledged event.
In our example, I'll assume you're adding a second rule named Escalate to your user account, but the rule can be added to any user or group.
In the Alerting Rules properties for the new rule, set the following fields:
- Address: The e-mail address of on-call admin
- Add filter for Count. For the comparison select>= and enter 5 for the value
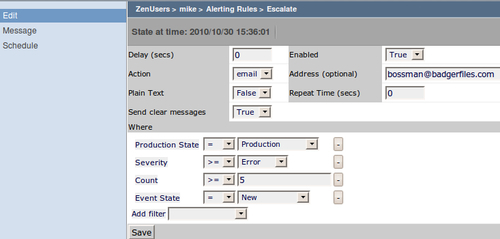
By adding the new filter, the rule will only be triggered if a event has been unacknowledged for five consecutive times.
Note
It's important to note that Zenoss Core will only send one alert based on the alerting rule's criteria. If you want multiple alerts to be sent, then you need to set up a new alerting rule with the "escalation point".
By default the alerting rules will be active 24/7, but we have the ability to schedule the active time frame for each alert.
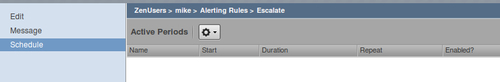
We may set a schedule for each alerting rule so that the rule sends alerts only during the specified period. When editing an alerting rule, click on the Schedule link (in the sidebar) to view the Active Periods table.
The Active Periods table displays a list of schedules sorted by Name with columns for Start, Duration, Repeat, and Enabled, as shown in the next screenshot:
To add a schedule:
- Select Add Rule Window from the Active Periods menu.
- Enter a descriptive name when prompted. I'm using Weekends as my example.
- Click OK to add the new schedule to the Active Periods table.
- Click on the name of the schedule to display the Status page.
- From the Status page, enable the schedule and enter the Start, Duration, and interval to Repeat. Sample values might include:
- Start Date: 10/30/2010
- Start Time: 0700
- Duration: 3 Days
- Repeat: Weekly
- Click on Save.
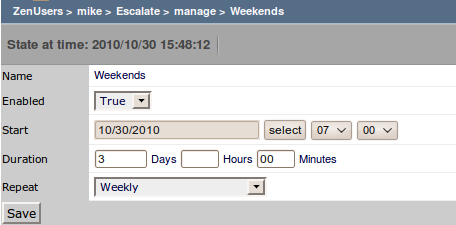
This rules starts at 0700 on 10/30/2010, which is a Friday. It will be active until Monday morning. Then, the alerting will become active again on each Friday in the future.
The following table lists the available schedule settings:
|
Property |
Description |
|---|---|
|
Enabled |
Set to True to enable the alerting rule during the specified time and duration. |
|
Start |
Specify the start date, hour, and minute. The hours are specified in 24-hour time. |
|
Duration |
Enter the Days, Hours, and Minutes to keep the alerting rule active after it starts. |
|
Repeat |
Available intervals are: Never Daily Every weekday Weekly Monthly First Sunday of the month |
We may add as many schedules to an alerting rule as we need to accommodate each user's work schedule.
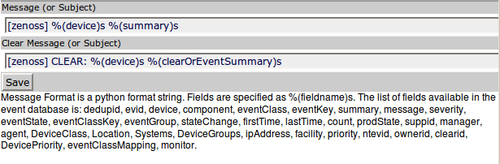
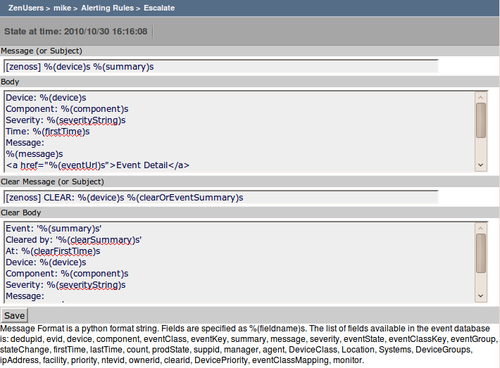
While editing our alerting rule, we have the ability to customize the text of the alert message. To view the message template, click on the Message link while viewing an alert.
We can specify the Subject and the Body for both the down alert and the clear alert. As the text at the bottom of the Message tab indicates, the "Message Format is a Python format string. Fields are specified as %(fieldname)s."
All the event fields are listed at the bottom of the page for reference:
If we set the alerting rule to send a page, we can only specify a subject line for the down and clear alerts because of likely character restrictions on the pager. The following screenshot shows the available message settings for a pager alert: