New installations automatically run a setup wizard that creates a user account, defines an administrator password, and discovers devices attached to the network. Many of you have probably already breezed through this step, but we'll step through the process for the benefit of those of you who are working through an initial install.
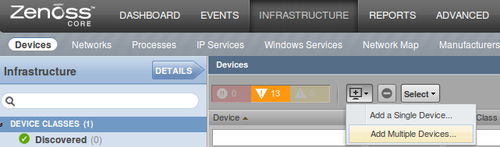
Even if you already ran the initial setup wizard, you can invoke the add device wizard by selecting the Add Multiple Devices... link on the Infrastructure | Devices page. See the following screenshot:
Note
To access your Zenoss Core installation, open a browser and navigate to port 8080 of your Zenoss Core server. For example, go to http://zenoss.example.com:8080 where zenoss.example.com is your web address.
If this is a new installation, you will be greeted with the setup wizard when you visit the Zenoss Core application. Otherwise, you will see the Zenoss Core Dashboard.
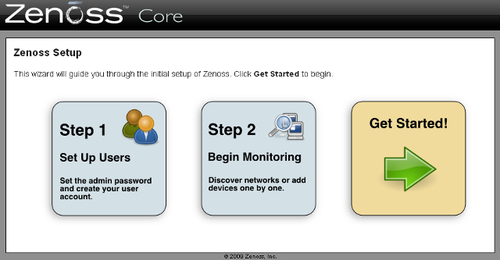
Click the big green arrow to advance the wizard to the Set Up Initial Users screen.
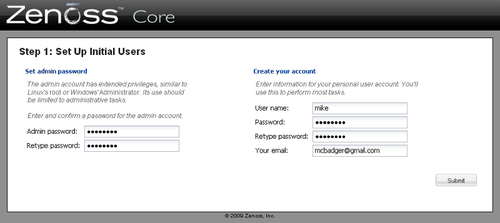
The user setup screen will ask you to provide two important pieces of information. The first is an administrative password for Zenoss Core's built-in admin user. You also set up a privileged user account by specifying a User name, Password, and email address.
Note
The admin user in Zenoss Core has superuser privileges, similar to root access on a Linux machine.
It's generally considered bad form to work under a system's admin account, and the same philosophy holds with Zenoss Core. Zenoss Core logs each user's activities throughout the system, so you don't want multiple people making changes as the admin user.
The user account we setup should accommodate all our monitoring tasks.
As we'll see in the user management section of Chapter 8, Settings and Administration we can control user access to the system via roles.
Click the Submit button after you have entered all the information.
Now we have some choices to make. Do we manually add devices, one at a time? Or do we let Zenoss Core discover the devices attached to the network. Each choice will lead to a different set of choices about how the device is discovered and classified by Zenoss Core, and device classification is an important concept in our monitoring activities.
Classes in Zenoss Core establish a default set of monitoring characteristics for a type of device, specifically, the collector plugins. The collector plugins determine what information Zenoss Core collects from each type of device. As we'll find out in Chapter 3, Device Setup and Administration when we review device classes in-depth, we can always change the defaults and change the classification.
If we manually add devices, Zenoss Core will assign the device to the class based on the device type we select. For example, if we select Linux Server, the device class will be /Server/Linux. In contrast, if we autodiscover devices, Zenoss Core classifies all our devices in a generic /Discovered class, and we will manually have to classify the devices.
Note
To enter devices in advanced mode, click the link titled skip to the dashboard. Then you can skip to the start of Chapter 3,
When you add a device manually, you provide Zenoss Core the IP address or the hostname of the device. When you add devices automatically, you can specify an entire subnet or ranges of IP addresses.
Here are some reasons you may opt to manually add devices:
- You have a relatively small number of devices on your network
- Your network has a large number of devices with dynamic IP addresses (for example, Workstations)
Here are some reasons you may opt to autodiscover devices:
- You have a large number of devices on your network
- You need to probe multiple networks and IP ranges
Of course, what you choose to do is a judgment call. Let's look closer at each option.
If we choose to manually add devices, we then specify the device type. Available device types are Generic Switch/Router SNMP, Linux Server SNMP, or Window Server SNMP. Notice an SNMP trend?
Let's step through the process:
- Make sure the Manually find devices option is selected from the Add Devices screen.
- In the first text field, enter the IP address or the hostname of the first device.
- In the shaded Details box, select a device type from the drop-down box.
- In the SNMP Credentials field, enter the community strings required to connect to the device. The defaults are public and private.
- To add more devices, click the button with the plus (+) sign to display a new hostname/IP address entry field. Repeat for as many devices as necessary.
Before you click the Submit button, let's pause to talk about what is happening on this screen:
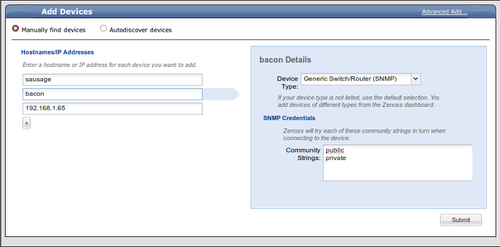
As you see in the screenshot, I have three devices specified: sausage, bacon, and 192.168.1.65. The hostname bacon is highlighted and contains an arrow that points to the bacon Details section of the screen. As you click on the hostnames, you'll notice the details section changes too. This allows us to specify a unique set of details for each of the devices we're going to add.
This is a big interface improvement over the earlier versions of Zenoss Core. In the next chapter, we'll take a look at the old add device interface, which has some of its own advantages.
When you have all of your devices entered, click the Submit button. Zenoss Core will create a job that tries to connect to each device using the details you specified for it. You'll be looking at the Zenoss Core dashboard after you submit the job.
Take a coffee or tea break. When you come back, we'll review the results of our work.
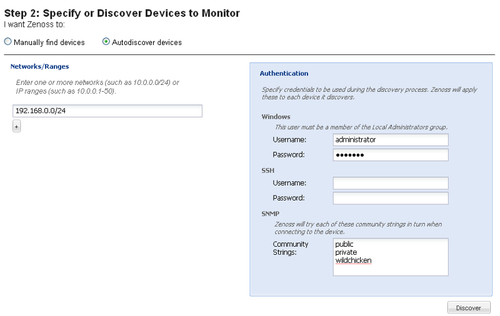
If we choose to autodiscover devices, we will be prompted to specify SNMP information, SSH login, or Windows administrator credentials. What you enter depends on what types of devices you expect to monitor.
Let's autodiscover some devices. For this example, I'm going to scan my employer, MoJo Active's, network.
- From the Add Device screen, select autodiscover devices.
- In the text field for Networks/Ranges, specify a network or an IP range.
- To add more than one network or IP range, click the button with the plus (+) sign on it.
- In the Authentication section of the screen, specify the credentials that are required to connect to the devices on your network.
- Click the Discover button to tell Zenoss Core to find your devices. You'll be transferred to the Zenoss Core dashboard.
The authentication options correspond to the monitoring methods we talked about earlier in the chapter.
If Zenoss Core discovers a Windows server, it will try to log in with the supplied username and password to retrieve information via WMI. It will also test the server with the supplied SNMP community strings.
If Zenoss Core discovers a Unix based machine, it will query the device with the SNMP community strings. It will also try to log in via SSH to determine if the Zenoss Plugins are installed.
We've just completed the easy part. Let's take a look at our results. From the main menu in the Zenoss Core interface, select Infrastructure to display a list of the devices you just added. Your device list will be unique, but it should resemble the following screenshot:
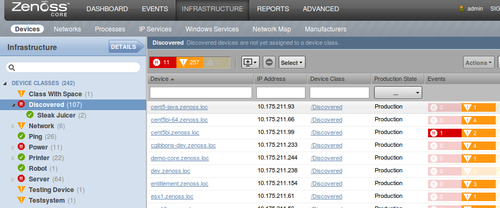
We have a table that lists the device name, the device IP, the class, the production state, and the number of events. That's a lot of information to process, and we're not going to be able to decode it all at once.
Right now, I'd like to draw your attention to the Events column.
If you're like me, you have several devices with warning level events, which are identified here by the color orange. These are errors that we need to address.
If you autodiscovered your devices, you're going to see more events per device than if you manually added each device. Let's take a look.
To view the details of an event, click on the event column for a device to display the Event Console for the selected device. See the following screenshot:
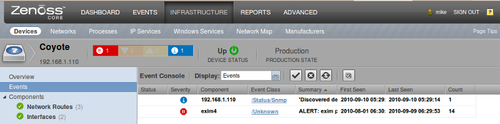
Chapter 6, Core Event Management and Chapter 7, Collecting Events are devoted to events, but as you look at the details of the events you can begin to see some problems. You might see problems with WMI, SNMP, or refused connections. You may also see blue informational events to let you know the device was discovered.
Note
Informational events will auto clear after four hours. You don't need to be concerned with them.
If you autodiscovered your network, you could see multiple events as Zenoss Core tried to connect to the device with WMI, SNMP, and SSH. Any failed attempts will generate an event that we have to deal with by properly configuring our devices to be monitored or by tuning how we monitor. We'll tune our monitoring in Chapter 5 , Custom Monitoring Templates, Chapter 6 , Core Event Management, and Chapter 7 , Collecting Events.
Note
To clear an event, highlight the event and click the Close selected event button at the top of the Event Console.
Manually adding the device will cause Zenoss Core to generate fewer events. However, you may see a warning event that indicates the SNMP agent is down, which indicates SNMP is not properly configured.
Before we can model our devices, we must resolve our SNMP, WMI, or Zenoss Plugin issues. Modeling our devices means we collect performance data, such as disk utilization, CPU utilization, and interface information.
Before we clean up our device inventory, let's take a look at the device discovery process in a bit more detail by examining the log file.
To review the log file from our device discovery job, click on the Advanced menu to display the Settings page. From the sidebar navigation, choose Jobs. Then select the Jobs tab to display a table of completed jobs. Actually, if the job is currently running, it will still show in this table with a status of running.
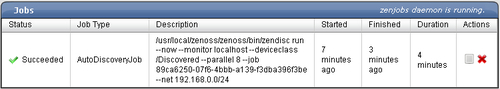
At a glance, we see some information about this job, most of which is self explanatory. The Description field provides the command that Zenoss Core ran. We can access the log file by clicking the icon that resembles a notepad under the Actions column
Click the notepad to display the log file:
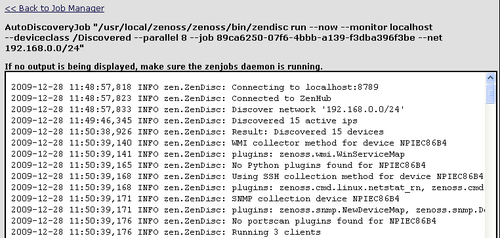
At the top of the log file, we can see that our device creation job ran the zendisc command:
$ZENHOME/bin/zendisc run --now --monitor localhost
--deviceclass /Discovered --job 015be396-c020-424f-bbd1-ad37cc28e6ec
--net 192.168.0.0/24
Zendisc is a device management command that operates in the collection layer of Zenoss Core's architecture.
The job of zendisc is to scan the supplied network or IP address for a device, and for each device it finds, create a device in the inventory. The discovered devices are added to the Zope database ZODB.
The command accepts several options. The --deviceclass option sets the default class for each new device. The --net option scans the supplied network. These command line options correspond to the values we entered in the add device wizard.
Note
To see the available options for zendisc, run the following command as the zenoss user: zendisc help.
When we work with the Zenoss Core commands from the command line, we need to work as the zenoss user, which was set up during installation. To become the zenoss user, run the following command:
su zenoss
<enter zenoss user's password>
Let's take a look at the log file for a manually added device and note the differences:
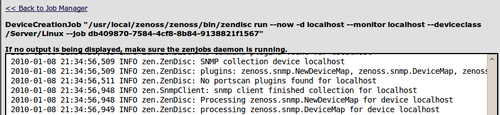
As the screenshot indicates, our command is:
$ZENHOME/bin/zendisc run --now -d coyote --monitor localhost
--deviceclass /Server/Linux --job 015be396-c020-424f-bbd1-ad37cc28e6ec
zendisc used the --deviceclass option to set the device class to /Server/Linux and the -d option specifies a hostname, instead of the --net option we used in the autodiscovery example.
As we step through each of our log files, we can see what transpires between Zenoss Core and the device. The zendisc daemon scans each device looking for SNMP, WMI, and the Zenoss Plugins.
In the screenshot of the manually added device, there are some lines that follow the format of Processing zenoss.snmp.DeviceMap for device localhost. This indicates that zendisc successfully connected via SNMP and is running each of the collector plugins for the /Server/Linux device class, of which zenoss.snmp.DeviceMap is one.