
The Zenoss Core documentation is rampant with references that you can use a Cacti plugin or Cacti compatible plugin, but there do not appear to be any readily available examples.
To help us find an example that you can use to as a guide to creating your own plugin, we once again turn our attention to the Zenoss bug tracker to review ticket #4945 (
http://dev.zenoss.com/trac/attachment/ticket/4945/single_dp_cacti_plugin.py). This script is similar in function to the bogo_check.py plugin we just installed and is authored by Kells Kearnery. This Cacti compatible plugin generates random data in a single datapoint value, which the Zenoss Core Cacti parser understands.
Everything we just did to add and configure a monitoring template can be done with a Cacti compatible plugin. Just feed the data the location of the script and you're on your way.
For each command-type data source, you have the option to set a parser. As you can see in the following screenshot, the choices are Auto, Cacti, Nagios, ps, and uptime. The default value is Auto and it's what we selected when we added the bogo_check.py plugin.
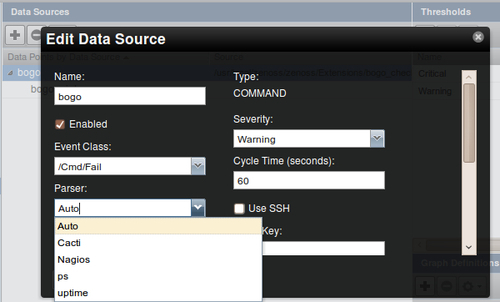
Cacti and Nagios obviously expect the output of a command to be in a specific format, and this chapter provides sample scripts for both. The ps and uptime values parse the output from their respective Unix commands.
It's helpful to know what your options are, but you probably won't have to change the parser type unless you're troubleshooting plugin problems.