We're going to edit an existing monitoring template that's already set up for SNMP. This will allow us to become familiar with the monitoring templates and discuss how Zenoss Core incorporates OIDs into the template's data source.
Rather than make changes at the class level, let's modify the device template for an individual device. In my example, I'll continue to work with my test server which is a member of the /Server/Linux class. If you don't have a Linux server in the /Server/Linux class, you can work through the example by editing the /Server/Linux template.
- Navigate to the device and select Details, and from the Monitoring Templates heading, select Devices (/Server/Linux).
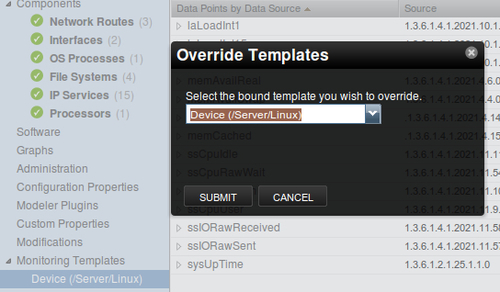
- From the Actions menu, select Override Template Here. In the Override Templates dialog box, select Device (/Server/Linux), and then click on SUBMIT.
- The monitoring template name changes to Device (Locally defined). Creating a copy of the template provides us with some protection from ourselves and is equivalent to making a backup of a file. We preserve the original template settings, so that if we don't like the changes we make to the local copy of the template, we can delete the local copy and restore the original settings.
- Let's Edit the Device (Locally Defined) template. Click on the template name to display the Data Sources, Thresholds, and Graph Definitions.
The Data Sources table lists the Name, Source, Source Type, and Enabled status for each data source. The Source Type is either SNMP or command by default. Additional source types can be added via plugins, ZenPacks, and add-on modules in order to extend Zenoss Core's functionality.
Note
The data sources vary depending on the device class. Here are a few examples:
The /Server/Linux class monitors multiple OIDs, which we've already seen.
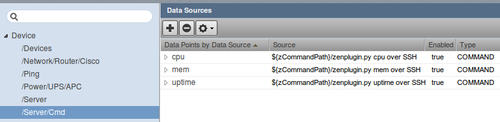
The /Server/Cmd class monitors with the Zenoss Plugins over SSH or Telnet, so its Source is the zenplugin.py file with a Source Type of command.
The /Server/Windows class relies on the SNMP Informant to collect data on a couple of OIDs; the /Server/Linux class by comparison, uses Net-SNMP and collects data for three times as many OIDs.
Not all device classes collect or graph performance data with their default templates. The /Server/Scan and /Server/SSH device classes have blank performance templates because they primarily monitor services in a way that may not report performance data, such as port scan in /Server/Scan.
Data sources and the related data points are the key components of a template because they define what data we have available to build thresholds and graphs. We'll explore the relationship between data points, thresholds, and graphs later in this chapter.
Let's make a few changes to the data sources for /Server/Linux to demonstrate how we can work with SNMP data sources. In the second part of this chapter, we'll work with command data sources when we create a template from scratch.
Currently, the /Server/Linux device template monitors the available physical memory (memAvailReal) and the available swap memory (memAvailSwap). The template defines what we graph and creates a minimum threshold for available memory.
That's great stuff, if you need it. Maybe you need to monitor physical memory and swap memory separately. Maybe you don't want to monitor any memory characteristics. No problem. There is nothing magical about the Zenoss Core default values. Zenoss Core can be easily customized to your needs, and we'll work through some template customization now.
Let's work through an example where we monitor memTotalFree for our Linux server:
- Navigate to the Linux server from the device list. Then select Device (Locally Defined) from Monitoring Templates.
- Let's add the memTotalFree data source. From the Data Sources menu, choose Add Data Source.
- In the Add Data Source dialog box, type memTotalFree for the Name. Select SNMP for the Type.
- Click Add. The memTotalFree Data Source is added, but it's not configured.
- To configure the data source, select memTotalFree from the list. Then select View and edit details from the Data source edit options menu.
- Set the following properties in the Edit Data Source dialog box.
- Set Enabled to True.
- Set OID to 1.3.6.1.4.1.2021.4.11.0.
- Set Type to Gauge.
- The Edit Data Source allows us to test the data source against a device. To run the test, type the name of the device name (my example uses coyote) and click the Test button.
- When you're sure that the data source is configured properly, click Save.
- The following screenshot shows the output of the data source Test command against a device:
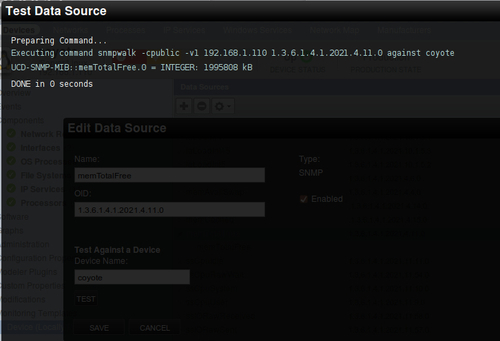
The Test Against Device field just ran the snmpwalk command against the device we specified using the community string and SNMP version from the zProperties. And it asked the device to report the value of the memTotalFree OID.
The value of memTotalFree or OID 1.3.6.1.4.1.2021.4.11.0 is reported in the screenshot with the line UCD-SNMP-MIB::memTotalFree.0 = INTEGER: 1995808 kB.
Note
Sometimes it's just faster to work from the command line. You can use the snmpwalk command to test a device for a specific OID by using a command in the following format:
snmpwalk -c <community> -v <SNMP version> <device> <oid>
If the snmpwalk command fails, then you have some troubleshooting to do. A good place to start is to verify your SNMP setup, which we covered in Chapter 2,
The other obstacle here is knowing which OIDs you have available to monitor. MIBs are collection of OIDs and Zenoss Core includes several MIBs that we can use to find OIDs.
Zenoss Core provides a MIB browser in the Zenoss Core web interface that we can display by clicking on the MIBs menu from the navigation sidebar. The problem is that the list is blank by default; however Zenoss Core stores lists of MIBs in $ZENHOME/common/share/snmp/mibs and $ZENHOME/common/share/mibs.
We can use the zenmib command to add the MIBs into the graphical MIB browser so we can find what we're looking for.
Since we used the 1.3.6.1.4.1.2021.4.11.0 OID in our example, lets pull its parent MIB into Zenoss Core so we can browse it. If we look back at the output of the snmpwalk test command we ran in the previous section, we see that the response line provides us with the MIB we care about, UCD-SNMP-MIB, which happens to be located in $ZENHOME/common/share/snmp/mibs.
To add all the OIDs in the UCD-SNMP-MIB to the MIB browser, let's open a command line and run the following commands as the zenoss user:
cd $ZENHOME/common/share/snmp/mibs
zenmib run UCD-SNMP-MIB.txt
When the zenmib command completes, it will provide some status information, such as the number of nodes that the MIB contained, which is 156 in our example.
Note
To add all the MIBs in a directory, use the wild card, *, in place of the MIB name. For example: zenmib run *.
Now, let's view the MIBs from Zenoss Core, which you'll find in the Advanced menu. We see UCD-SNMP-MIB listed with a Description, the number of Nodes, and the number of Notifications:
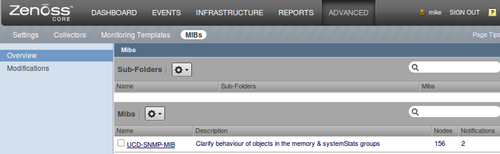
As the screenshot indicates, you can create sub-folders to organize your Mibs. We're not going to worry about that now. Let's browse the MIB instead by clicking on UCD-SNMP-MIB to display the properties of the MIB:
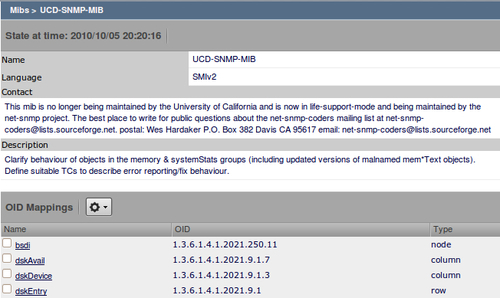
We learn some details about our MIB including contact and description information. In our example, we learn that UCD-SNMP-MIB addresses memory and system status, and it's maintained by the NET-SNMP project.
The list of OID Mappings is paginated, and we find memTotalFree on the second page. Click on it to display the properties for the OID:
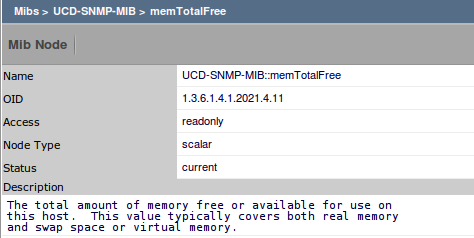
On the properties page for memTotalFree, we learn some additional details, such as the Access type, Node Type, Status, and Description. So now we know, in detail, what we are collecting. The chances are good, however, that you know most of this information before you import the MIB.
If we go back one page to the UCD-SNMP-MIB page, we see a Traps table at the bottom of the page:

We'll cover traps in more detail in Chapter 7, Collect Events, but traps allow the monitored devices to report events back to Zenoss Core. Then Zenoss Core can turn the received trap into an event.
We've walked through how we import a MIB, and as we've seen the MIB contains OIDs that we can use as our SNMP data sources in our monitoring templates. Even though Zenoss Core includes many MIBs, hardware manufacturers release MIBs that retrieve device-specific information. If you start seeing events with OIDs instead of a friendlier name, then you know you need a MIB.
Note
You can find MIBs from the manufacturers, directory sites, such as www.mibdepot.com, or by performing an Internet search.
Have you had enough MIB browsing for now? Let's shift gears and set up a monitoring template using a Nagios plugin. In the next section we will explore command data sources, thresholds, and graphs.