In the preceding chapters, we've seen how to set up our devices to be monitored by defining classes, modeler plugins, and components. We now turn our attention to one of the most flexible features within Zenoss Core: monitoring templates.
Templates are a graphical frontend to RRDtool. They collect performance data from our devices and add that data into Zenoss Core's data model so we can monitor and graphically display it.
In this chapter we will:
- Monitor using SNMP data sources, including MIBs and OIDs
- Monitor using a command data source (Nagios and Cacti plugins)
- Bind monitoring templates to device classes
This chapter roughly divides into two halves. In the first half, we tweak an existing template and add a new SNMP data source and OID.
In the second half, we create a template that uses a Nagios style plugin that randomly generates monitoring values; therefore it provides a great way to demonstrate or experiment with events, data collection, and the RRDtool. And the beauty of the plugin is that it does not require a real device to work.
Templates allow us to customize our data collection when we decide the Zenoss Core defaults no longer meet our needs. We could for example, collect data for a specific OID, implement a Nagios plugin, or create our own plugin.
Monitoring Templates tell Zenoss what data sources to collect from and how to graph the data. They can also establish monitoring thresholds on the collected data, which we can use to generate events. We apply templates to the device class or to the individual device. In Zenoss terminology, the process of applying a template to a device or a class is called binding.
To view all the monitoring templates in Zenoss Core, click on the Advanced menu and then select Monitoring Templates. In the sidebar you will see an expandable list of templates. Let's look at an example.
Expand the Device heading and click on /Server/Linux. The details of the template will display, as shown in the following screenshot:
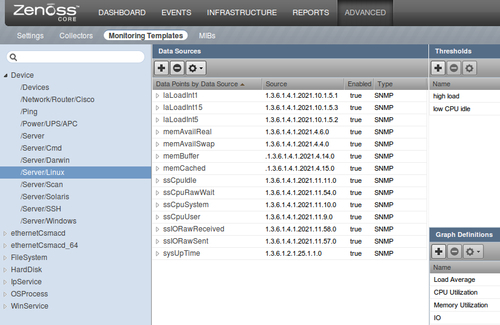
As you look over the list of monitoring templates, you should make some connections to Chapter 4, Monitor Status and Performance, where we reviewed device components. The FileSystem, IpService, OSProcess, WinService, HardDisk, ethernetCsmacd_64, and ethernetCsmacd monitoring templates match the components we saw on the OS tab in the previous chapter.
The Data Sources tell Zenoss Core what information to collect and define the type of data it is. Zenoss Core supports SNMP, command, and built-in data types. It supports the following data types:
- SNMP: Uses an OID value.
- Command: Uses the output from a shell command in a Nagios or Cacti compatible plugin. The Zenoss Plugins we talked about in Chapter 2, Discover Devices are a command type data source.
- Thresholds: If defined, this will generate an event when the data source collects information that crosses the threshold.
- Graph Definitions: This provides rules to display a graphical representation of the information collected from the data source and the thresholds.