
In the previous chapters, we've explored the out-of-the-box functionality of Zenoss Core. In this chapter, we'll explore ZenPacks. ZenPacks are add-on modules and are the most common way for the Zenoss community to extend Zenoss Core's capabilities. In this chapter, we will learn how to:
- Install
HttpMonitor—acommunity ZenPack to monitor the response time and content of a web page - Create a ZenPack using the bogo_check plugin that we configured in Chapter 5,
- Package and distribute a ZenPack
The examples in this chapter provide a solid understanding of how you would install or create a ZenPack. As with all the other examples in this book, it's up to you to apply the concepts to your individual monitoring environments.
Let's start by installing HttpMonitor.
My goal will not be to review all the ZenPacks currently available or try to anticipate your exact monitoring needs. Rather, we're going to walk through the process with a relatively simple example to monitor websites with the HTTPMonitor ZenPack.
Note
Find ZenPacks online at http://community.zenoss.org/community/zenpacks.
Many ZenPacks are community contributed and are reviewed by the Zenoss team prior to being made available for download. Still, it would be wise to install a ZenPack on a test installation of Zenoss Core before you commit an unknown change to your monitoring environment.
As of December 2010, Zenoss Core 3.0 has been out for six months, but not all ZenPacks are compatible with the latest version of Zenoss Core. Check the ZenPack download page to ensure 3.0 compatibility.
Installing a ZenPack consists of three general steps:
- Download the ZenPack from the Zenoss ZenPack Project Site.
- Install the ZenPack.
- Configure the devices to use the ZenPack.
Let's demonstrate the process with the HttpMonitor ZenPack, which monitors the status and response time of a website.
Always check the documentation that accompanies a ZenPack for clues about functionality and additional configuration steps. You should also make sure you meet any prerequisites. The following screenshot shows the download page for our HttpMonitor ZenPack.
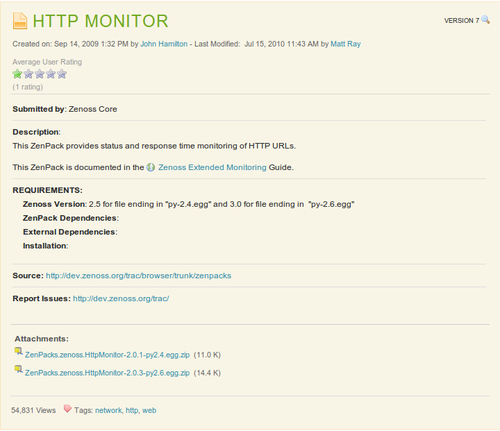
As the screenshot shows, ZenPacks are available in multiple versions. Zenoss Core 3.0 ZenPacks will have a py2.6 in the file name while ZenPacks for earlier versions of Zenoss Core will have py2.4 in the file name. The nomenclature refers to the Python version. Zenoss Core 3.0 is based on Python 2.6 and previous versions were based on Python 2.4.
Let's begin by installing the HttpMonitor ZenPack:
- Download the HttpMonitor package from the ZenPack project site and unzip the file. When you unzip the file, you will have a Python package in
.eggformat. - From the Advanced menu, navigate to Settings | ZenPacks.
- From the Loaded ZenPacks table menu, select Install ZenPack.
- Browse for and select the HttpMonitor ZenPack you downloaded.
- Click OK to install the ZenPack.
- Restart Zope by running the command
zopectl restart.
After the ZenPack installs, Zenoss displays the results of the ZenPack installation in the browser window, as shown in the following screenshot:
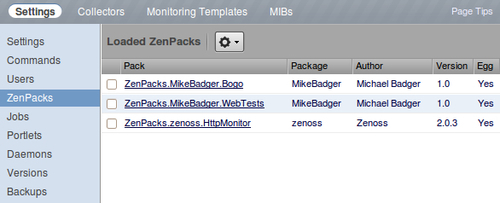
As you can see from the screenshot, it's possible to have multiple ZenPacks installed.
Note
Sometimes we may have problems (for example, timeouts) installing a ZenPack from the web interface. We can also install with the zenpack command. Using our HttpMonitor example, here is the command:
zenpack ‑‑install ZenPacks.zenoss.HttpMonitor-2.0.3-py2.6.egg
zenoss restart
Note that we install the ZenPack after we unzip it.
Installing the HttpMonitor ZenPack gives us access to new monitoring functionality but we won't be able to use that functionality until we configure a device, device class, and monitoring template to monitor with the ZenPack.
We can get a good idea of the capabilities of any ZenPack we install by viewing the list of objects that the ZenPack provides.
The HttpMonitor ZenPack is distributed by the Zenoss team and is now documented in the Zenoss Core Extended Monitoring Guide. For that reason, we won't cover this ZenPack feature-by-feature.
After we install the ZenPack, we can view its details by clicking on the package name in the list of Loaded ZenPacks. Among the meta information, you'll see a list of files and a list of objects provided. It's the ZenPack Provides list that gives us the most insight into its functionality:
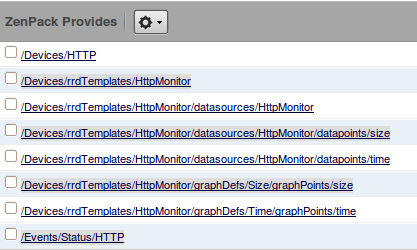
Based on the names of the items in this list, we know that the ZenPack installs a new device and event classes, /Devices/HTTP and /Events/Status/HTTP respectively. The other objects include a monitoring template called HttpMonitor that adds a new data source to graph size and time values. You can click on each item to go directly to its configuration screen.
We've covered all the concepts required to use the ZenPack in previous chapters: device classes in Chapter 3, Device Setup and Administration, event classes in Chapter 6, Core Event Management, and templates in Chapter 4, Monitor Status and Performance and Chapter 5,
One of features of this ZenPack is that it adds its own configuration screen. Let's take a look.
Pick a website to monitor and add it as a device to the /Devices/Http class. You're now monitoring the availability and response time for the website. It doesn't get much easier than that. Add as many websites as you care to monitor.
Monitoring response time may be helpful to you. For me, it's not my primary concern. A more important use case for me is to monitor my websites to ensure the Google Analytics tracking code is always present. Sometimes during site updates the tracking code gets nuked. Among other things, HttpMonitor can check the contents of the web page for text and generate an event if the text isn't found.
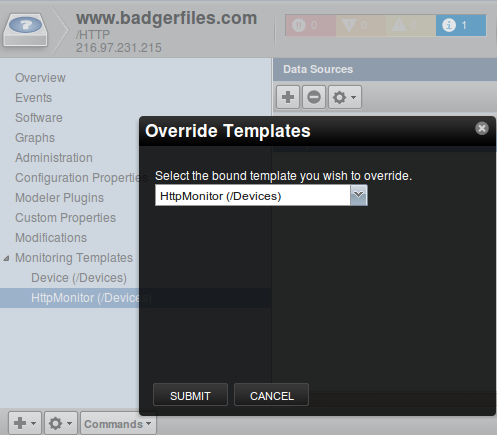
In order to monitor unique content for each website, we need to override the monitoring template for each device. We learned how to override templates in Chapter 5, Custom Monitoring Templates. To override the default template, navigate to the device and select Override Template from the Actions menu.
The following screenshot shows the Override dialog box for a website that I'm monitoring. After you select the template you want to override, submit the change. Now we can configure the locally defined version of the template, and any changes we make will be isolated to the selected device, which provides us the flexibility to monitor unique properties for each site.
A new copy of the template will be created for the device and listed as a subitem of the HttpMonitor Template.
The HttpMonitor ZenPack adds its own interface to configure specific monitoring properties, such as authentication, regular expressions, and page redirects.
Let's take a look. I'll be using my website http://www.badgerfiles.com:
- Select the overridden template you just created in the last section.
- Select the HttpMonitor data source and select View and Edit Details from the Data Sources menu. The Edit Data Source dialog box displays.
- The first half of the Edit Data Source window shows us the normal configuration options that we reviewed in Chapter 5, Custom Monitoring Templates. If you scroll down the window, however, you will notice that we have an entire section dedicated to HttpMonitor. The following screenshot shows the options:
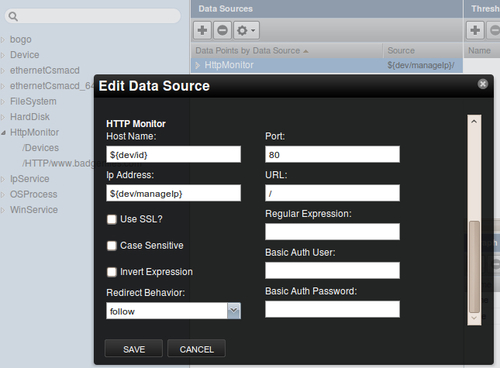
These options should be self-evident and more information can be found in the Zenoss Core 3.0 Extended Monitoring Guide. However, I'll call out a few items of interest—or at least things I want to draw your attention to.
The Host Name and Ip Address fields use TALES expressions to reference the device. That way when HttpMonitor polls the device, it just substitutes the device ID for the host name. That's why you enter your device as www.example.com.
The Regular Expression field lets us search for a specific piece of text on the page. Select the Invert Expression checkbox to check if the defined regular expression is not present.
HttpMonitor will generate an event when it monitors the device and finds a condition that is not true with regard to the settings.
Assuming you have something unique to monitor for all your websites, you'll need to create a local template for each device.
Note
Want to see the code that implements the graphical interface for the settings? You can start with the interfaces.py and editHttpMonitorDataSource.pt files for real-life programming examples. To find the path to these files, view the Files in ZenPack section of the interface, available from Advanced | Settings | ZenPack | ZenPacks.zenoss.HttpMonitor.