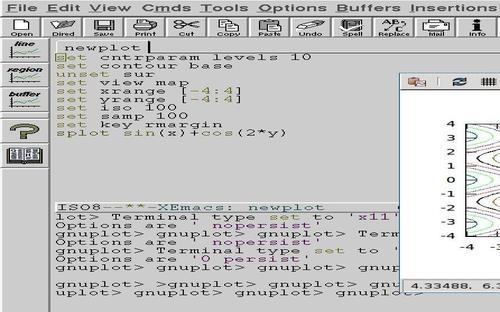
Emacs is one of the two most venerable and powerful text editors used by programmers and other expert users of computing systems derived from the UNIX fork of computer history. While the other one, Vim, is of course superior, Emacs has the ability to be customized to such an extreme extent that it can be turned into a textual or even a graphical interface for other programs. There are Emacs modes for reading mail and netnews, playing games, and much more. In this recipe, we will introduce Emacs gnuplot-mode, which is a useful GUI for gnuplot.
Naturally, you need to have Emacs installed. Emacs comes in various flavors. You need one with hooks into your operating system's graphical libraries compiled in. If you are on Linux or Apple's OS X there is a good chance that you already have such a version of Emacs installed. Most versions of Emacs for Windows should also work. We mention this because there is a small chance that you might have a stripped down version that cannot support a GUI customization, in which case you will need to upgrade your Emacs before trying to use gnuplot-mode.
You will need to install gnuplot-mode using whatever method you use on your system to install Emacs modes. It is normally not installed by default. On Linux systems such as Ubuntu, it is packaged separately (and called "gnuplot-mode") by the system package manager. If all else fails you can download it from its github home at https://github.com/bruceravel/gnuplot-mode/downloads.
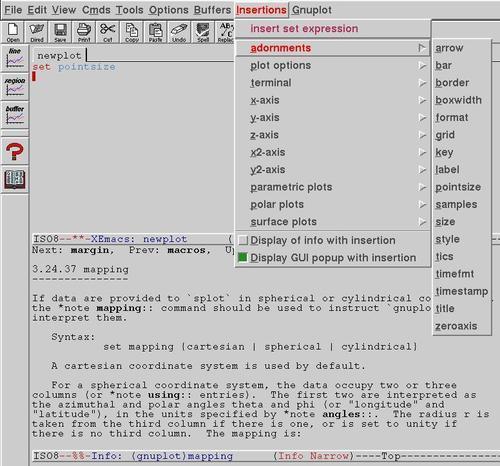
The gnuplot-mode editing mode for Emacs provides a handful of facilities that make writing gnuplot scripts more convenient. It offers syntax coloring, automatic completion of gnuplot keywords, automatic indentation, as well as a system of menus to help us when we forget how to do something in gnuplot. It includes its own interface into the gnuplot help system, too.