
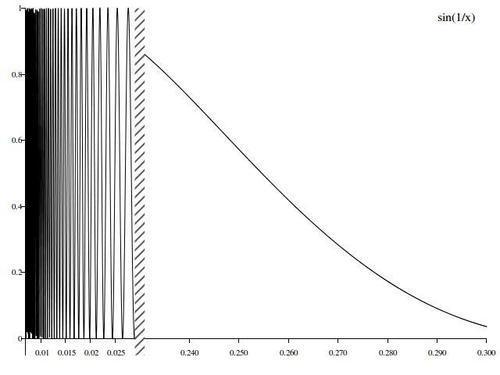
Sometimes we would like to plot something over two disjoint domains, but want the plot to be contained in a single graph. In this case, we need to indicate that there is a discontinuity in the axis and generate two separate sets of tic marks, as shown in the following figure:
The following gnuplot script will produce the previous figure. It is provided with this book as a file called breaking_an_axis.gnuplot. Run it with gnuplot breaking_an_axis.gnuplot to get a PNG file that should look just like the previous figure. If you don't have the pngcairo terminal installed, you can use the png terminal or anything you wish, but you may get a different pattern in the vertical box. Type test at the gnuplot interactive prompt after setting your terminal (and output file if you are not using an interactive terminal) to see a list of the available patterns.
set term pngcairo font "Times,8"
set out "plot.png"
set border 2
set zeroaxis lt -1
set ytics axis nomirror
set xtics axis nomirror
set tics out
set samp 5000
set xrange [0.007:.1]
set yrange [-.05:1]
s = .2
b = 0.03
w = .001
h = 1
h(x) = sin(1/x)**2
f(x) = (x<b?h(x):NaN)
g(x) = (x>b?h(x+s):NaN)
set xtics .005, .005, .025
set for [n = 4 : 10] xtics add(sprintf("%.3f", s + n/100.0) n/100.0)
set object 1 polygon from first b-w,-h to b+w,-h to b+w,h to b-w,h to b-w,-h front
set object 1 fillstyle pattern 5 lw 0
set key font "Times,12" samplen -1
plot f(x) title "sin(1/x)" lt -1, g(x) notitle lt -1
The script plots a function over two disjoint sections of the x-axis; the first near x = 0 and the second from x = 0.03 to x = 0.3.
We include a font specification with the set term command to make sure there is enough space between the tic labels.
The command set border 2 draws a border only on the left side of the plot, leaving the other three sides blank. help set border will explain the syntax.
The next command tells gnuplot to draw a pair of solid, black axes through the origin. We'll only see the x-axis, as the y-axis is off the graph. Its place is taken by the border.
The following three commands put tics on the axes and make them stick out of the graph area. We specify a large number of samples because our function is quickly varying and set an xrange to avoid the singularity at the origin. Our yrange leaves a little space below zero, which will allow our polygon to overlap the axis.
Our goal is to plot the function sin(1/x)**2 over two disjoint domains. To do this, we define three functions. But first, it is convenient to define a few variables. The variable s the shift, which is the amount by which the second segment of the graph is shifted relative to the first. We plot a piece of the function, then skip ahead by s along the x-axis, then continue. Next we define b, which is where the break occurs on the x-axis. The next two variables have only to do with the decoration that we shall use to indicate the discontinuity in x values: w is its width and h is its height, both in axis coordinates.
Now we define the functions. h(x) is simply the function that we are plotting. The next two are defined using the ternary syntax introduced in Chapter 7, Programming gnuplot and Dealing with Data where we learned how to plot on subintervals. f(x) is defined to be equal to our function h(x) below x = b (the breakpoint) and is set to be undefined above x = b. g(x) is defined to be h(x) but shifted by an amount s, and is only defined above the breakpoint.
We need two sets of tics and tic labels for the two separate sections of the plot.
The tics for the left-hand section are defined with the line set xtics .005, .005, .025: the syntax is start, interval, end.
The tics for the right-hand section are established with the following line, which uses gnuplot's looping syntax (see Chapter 7, Programming gnuplot and Dealing with Data). For each value of n in (4, 5, ... 10), we add a tic at position n/100. The label printed for the tic is encoded using the sprintf function, which uses the same syntax as in the C language. %.3f means to represent the number as a float with three decimal places. The numbers that we print are shifted by the shift variable s. Since we are shifting the tics and the function argument by the same amount, the graph will be correct.
We need some device to show that there is a discontinuity in the set of x coordinates. Here we've chosen a style that makes this hard to miss, by creating a long, thin rectangle enclosing a hatch pattern that lies over the break in the axis.
To do this, we use gnuplot's new object facility. We define a polygon object using the variables that we defined earlier for its width and height, and for the breakpoint. The final point repeats the first to close the polygon.
The next line sets some properties of the polygon. We set its fill pattern and set its linewidth (lw) to zero so it won't have an outline.
Before plotting, we want to make the legend font bigger, since we set the default font a little small to make room for the tics. The clause samplen -1 causes the legend to be printed with no line sample, since there is only one curve. Thus, we're using the key as a convenient way to make a title for the plot that will save space by being placed inside it.
The plot command in the last line plots both segments of the curve as black solid lines (lt -1), sets the title for the curve, and makes sure not to repeat the title for the second part.