
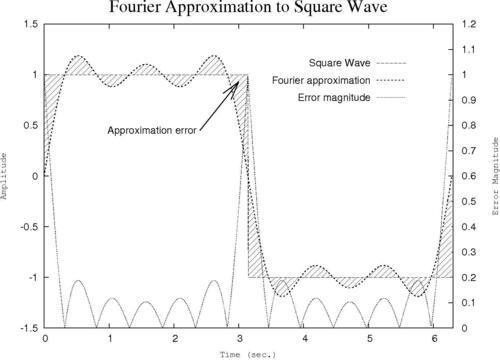
Complex graphs can often benefit from information in addition to what can be provided in a title, in the axis labels, and a legend. Sometimes we need to explain the meaning of a particular feature on the graph. This can be done with labels and arrows.
Following is the complete script that you can feed to gnuplot to create the graph:
set term postscript landscape
set out 'fourier.ps'
set yrange [-1.5:1.5]
set xrange [0:6.3]
set ytics nomirror
set y2tics 0,.1
set y2range [0:1.2]
set style fill pattern 5
set key at graph .9, .9 spacing 3 font "Helvetica, 14"
set xlabel "Time (sec.)" font "Courier, 12"
set ylabel "Amplitude" font "Courier, 12"
set y2label "Error Magnitude" font "Courier, 12"
set title "Fourier Approximation to Square Wave" font "Times-Roman, 24"
set label "Approximation error" right at 2.4, 0.45 offset -.5, 0
set arrow 1 from first 2.4, 0.45 to 3, 0.93 lt 1 lw 2 front size .3, 15
plot 'ch2.dat' using 1:2:(sgn($2)) with filledcurves notitle, '' using 1:(sgn($2)) with lines title "Square Wave", '' using 1:2 with lines lw 2 title "Fourier approximation", '' using 1:(abs(sgn($2)-$2)) with lines axis x1y2 title "Error magnitude"
We have highlighted two new commands that together supply some additional annotation to our graph. The first highlighted command places a label with text given in quotation marks immediately following the words set label. The phrase right at 2.4, 0.45 places the label right justified at x = 2.4 and y = 0.45 using the first coordinate system. The use of this coordinate system is the default and is convenient, because the point can be read directly from the graph axis. first means that we are using the left-hand y-axis; the second coordinate system is also available, which uses the right and bottom axes. The offset parameters shift the label by the amount given in the x and y directions using the character coordinate system. The values used in the script shift the label to the left by half a character width, creating a small space between the end of the label and the beginning of the shaft of the arrow. Finally, we set the font and type size for the label. (In place of the keyword right, we also have center and left available, which create their respective justifications.)
The second new command draws an arrow, which we have given a tag of 1, from a starting point at x = 2.4, y = 0.45 in the first coordinate system (the same point at which our text label was right justified to) to an ending point in the hatched region at x = 3, y = 0.93. The rest of the arrow specifications set its line type (lt) and line width (lw), tell gnuplot to plot the arrow on top of the graph data (front), and give the size of the arrowhead: the first number, .3, is the length of the sides of the head in graph units; the second, 15, is the number of degrees of angle from the shaft of the arrow to the head.
It is usually impossible to get the positioning of the labels and arrows correct on the first try. One usually resorts to repeatedly making plots while adjusting the positioning coordinates until everything looks right. The tag in the set arrow command allows you to change the details of the existing arrow, simply by issuing another set arrow 1. Without this tag, gnuplot would simply create a new arrow. If you want to adjust the positioning of your labels, say unset label, and repeat the labeling commands with new parameters, or use tags for your labels as we did for the arrow and simply redefine them. In this way, you can iterate, issuing a replot command after each arrow and label definition, until the plot looks the way you like it. Then, if you want to save your plot, use the set output command to open a file for output, and reissue your plot command.